Guided Tour of the Pathway Logic Model: VMac
Introduction
Macrophages (Greek: big eaters) are a type of white blood cell.
They serve as `garbage collectors', scavanging cellular debris,
foreign substances, microbes, cancer cells, and other unhealthy
cells, in a process called phagocytosis. They are also key
players in the innate immune system, presenting information about
pathogens they have found and emitting and receiving cytokines
the control immune response.
VMac (Virtual Macrophage) is an executable model of signal
transduction processes in macrophages represented in Pathway
Logic (PL) and thus can be browsed, queried, analyzed using the
Pathway Logic Assistant (PLA).
VMac is derived from the Cell Designer representation of
the Macrophage Map.
This map was
curated from assertions in biomedical literature augmented with information
from databases, including BioModels, PANTHER Pathway, and
TRANSFAC. Details can be found in
this paper.
Python code was written to extract information from the Cell Designer XML needed to construct PL rules. In addition to the Cell Designer XML input, the extraction required several auxiliary tables mapping; mouse Uniprot identifiers to human Uniprot identifiers Uniprot identifiers to PL names; Cell Designer identifiers of complex species to PL names (created by a biologist as complex components were not uniformly represented in the XML). PL code was written to check the resulting rules for well-formedness and problems fixed by hand or by adapting the python code to access information in different places. Finally, representations of rule components were normalized to maximally connect the rule network (mismatches include location, level of abstraction, and use of the active modification). In some cases it was necessary to look at the graphical map to resolve ambiguities, inconsistencies, or missing information, due to some non-uniformity in where information is representing in the XML, making fullt automatic extraction problemantic.
The Macrophage Map provides pubmed identifiers as justification for many of the reactions. In this case these identifiers are captured as rule metadata and accessible by clicking on the rule to open the rule information panel and then clicking on the `rule evidence' button. Clicking on a linked pubmed id takes you to the paper. Caveat: In some cases multiple pubmed ids are associated with a reaction, possibly different papers refer to different controls/biological context for the reaction. In the PL representation the reaction with multiple different controls leads to multiple rules, one for each control. We made no attempt to assign relevant subsets of the pubmed ids to reaction instances.
The source Macrophage Map is organized graphically (and conceptually) in several sections: Response to
- 1. Interferons (Ifna, Ifnb1, Ifng)
- 2. Ras/Raf/Erk
- 3. Pkc/Pi3k/Akts
- 4. Toll-/NOD-/retinoic acid–inducible gene–like receptors
- 5. growth factors
- 6. hypoxia
- 7. chemokines
- 8. complement/integrins
- 9. Interleukins
- 10. pathogen molecules
- 11. caspase activation
- 12. transcriptional regulation
- 13. translational regulation
- 14. production of reactive nitrogen species/ROS/antimicrobial peptides
- 15. production of lipid mediators
- 16. triggering of cytokines/chemokines/macrophage phenotypes
This guide assumes that the user is already familiar with the use of PLA as described in the SmallKB guide and the PLA reference manual .
In this guided tour, double click on a figure to see an enlarged version. Single click to restore the figure to its original size.
Pathway Logic Notation
We briefly summarize PL concepts and notation. A simple occurrence is an instance of a protein, gene, or chemical. Each occurrence has a location and may have modifications. For instance Ikke-gene@NUc is an occurrence of the Ikke gene in the nucleus, Irf3-act-phos@CLc is the Irf3 protein phosphorylated and activated in the cytoplasm. When rendered graphically, simple occurrences are ovals labeled by the occurrence name. Complexes are rendered as rounded rectanglular stacks with a level in the stack for each complex component. A rule represents a biochemical reaction. Graphically a rule is a rectangle labelled by the rule identifier. (We use the original Macrophage Map identifiers.) Incoming/outgoing solid arrows connect rules to the reactants and products, and incoming dashed arrows connect rules to controls (also called rule modifiers). These are enzymes or other entities that are required for the reaction to take place (at a noticible rate), but are not themselves changed. Clicking on a node in a graph will give you the meta-data panel for that node.
The following lists notation used for locations and modifications in VMac.
Locations
  XOut --- Outside the cell, the medium or supernatant
   CLc --- Cytoplasm
   NUc --- Nucleus
   ENl --- Endosome lumen
   ERc --- Endoplasmic Reticulum cytoplasmic side
   LSl --- Lysosome lumen
   PSl --- Phagolysosome
   Sig --- A pseudo location for phenotypes
Modifications
 phos  --- phosphorylated
 phos-site --- phosphorylated at site
 Yphos --- phosphorylated on a tyrosine
 Sphos --- phosphorylated on a serine
 Tphos --- phosphorylated on a threonine
 act   --- activated
 ubiq  --- ubiquitinated
 dimer --- dimerized
 degraded --- degraded
Exploring the Macrophage Map using PLA.
Introduction
If you haven't already started the VMac online demo, you can do so by clicking here and following the instructions to launch the VMac model from the downloaded PLA launcher.
When PLA starts up, a knowledge base manager (KBManager) window (title: VMac) appears in the upper left corner of your screen. Start by selecting a predefined dish: press the "Select Dish" button on the right side of the KBManager window. This produces a menu with two options: "Edit" and "PreDefined". Select (click on) "PreDefined". This produces a (sub)menu with a list of pre-defined dishes. In the VMac case there is only one, namely MPhiDish. Select this dish by clicking on the corresponding menu item.
Shortly a PLA Tab Frame window with one tab labeled graph2:MPhiDish (shown in the screen shot below).
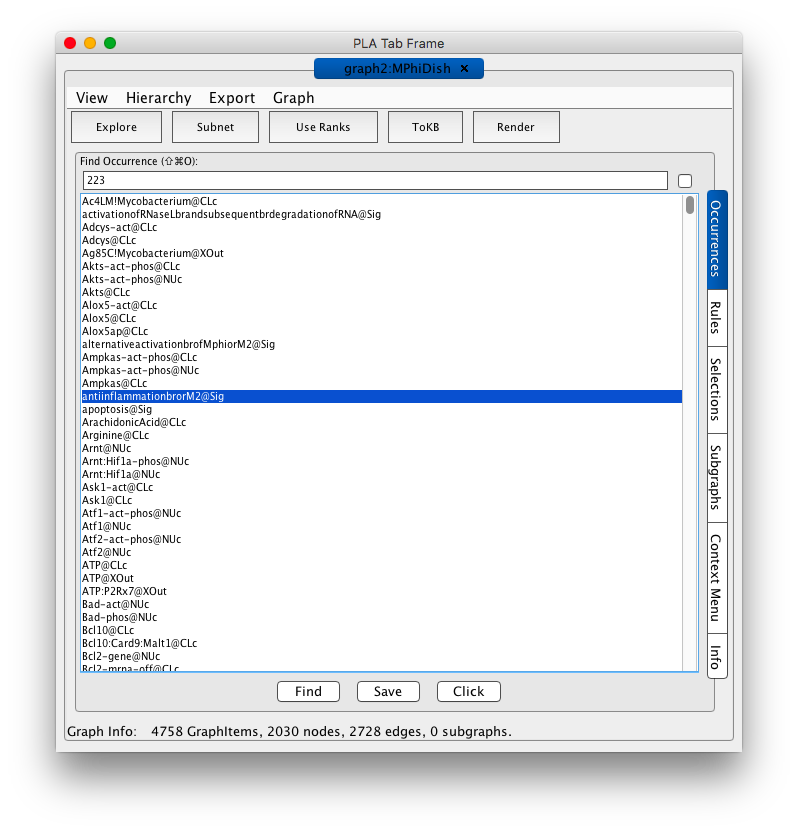
Screen shot of the MPhiDish initial tab frame
Because the graph is large it is not automatically rendered. Instead you are presented with the occurrence panel where you can scroll through the list and get information about specific occurrences. For example by double clicking on an occurrence the associated information window will appear and you can access metadata about the occurrence. From the selections tab on the right you can define queries to derive subnet works of interest by specifying occurrences as goals or avoids and rules to hide. You can also explore the network starting from specific occurrences or rules. These options are illustrated below. If you want to see the full graph, press the Render button in the tool bar and be a little patient.
[Note that the graph numbers in titles may differ if you have created graphs or nets in addition to those discussed in the demo. This is fine.]
Exploring downstream of the Ikke gene
Ikke is a protein that plays a key role in coordinating the activation of irf3 and Nfkb1 the innate immune response. We can extract a model of this process from VMac by exploring downstream of the Ikke gene (occurrence Ikke-gene@NUc). To do this, find Ikke-gene@NUc in the occurrence panel (use the scroll bar and double click, or type Ikke in the search window and repeatedly `tab' until Ikke-gene@NUc appears, then press Find). This gives you the information panel for this selected occurrence. Now press the Explore Occurrence button and an initial explore tab will appear.
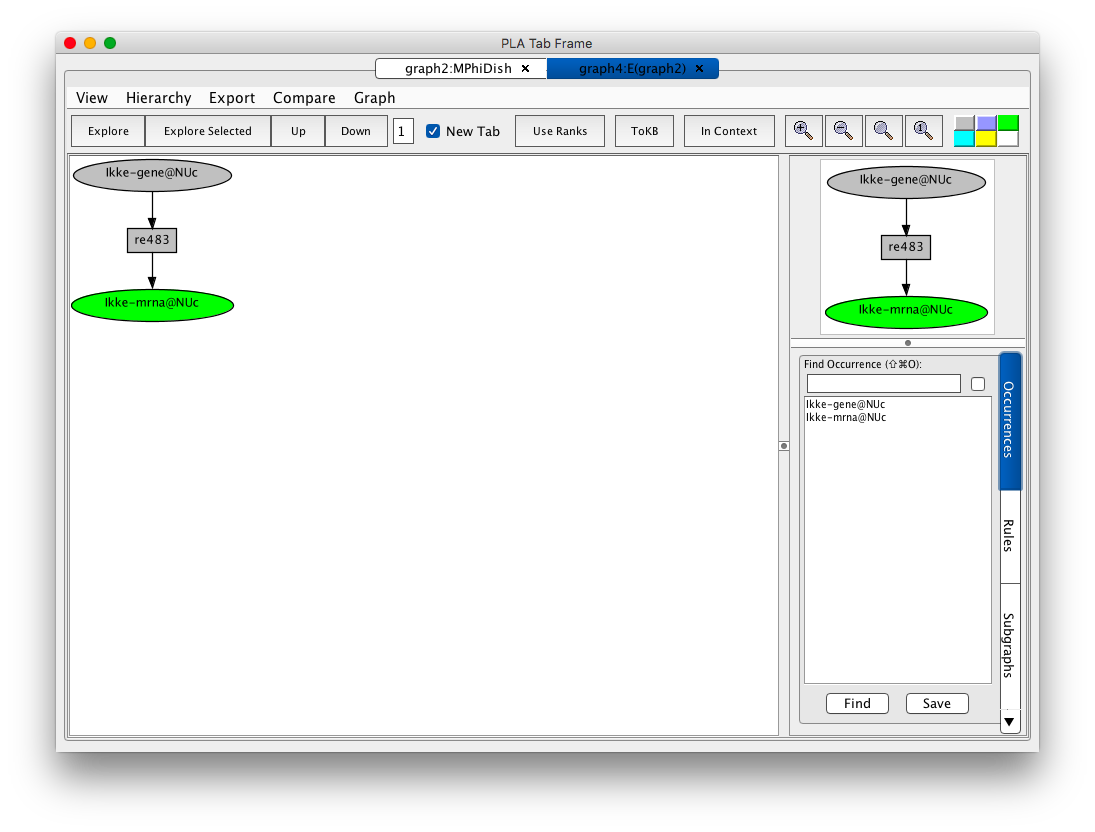
Screen shot of the initial exploration graph for the Ikke gene
A network of reactions is displayed as a graph with two kinds of nodes. Ovals represent occurrences—proteins or chemicals in a specific state and location. Rectangles represent reactions/rules. The color key at the right end of the tool bar explains the color coding of nodes.
Darker colored ovals represent occurrences in the initial state (the selected dish when the network is generated by choosing a dish). Lighter colored ovals represent potential states/locations of these components.
Rectangles represent rules. The label in a rectangle is its (abbreviated) identifier in the knowledge base. Solid arrows from an occurrence to a rule indicate that the occurrence is a reactant (rule input). Solid arrows from a rule to an occurrence indicate that the occurrence is a product (rule output). Dashed arrows from an occurrence to a rule indicate that the occurrence is a modifier/enzyme/catalyst—it is necessary for the reaction to take place but is not changed by the reaction.
Now explore down from Ikke-mrna@NUc (click on the node, check the explore down box in the context menu, then press Explore Selected in the menu bar). Continue exploring downward using the following instructions where ( `occurrence' d) means click on `occurrence', check the explore down stream box in the information panel, then press Explore Selected in the tool bar.
- ( Ikke-gene@NUc b ) --- the initial step
- ( Ikke-mrna@NUc d ) --- explore down from Ikke-mrna@NUc
- ( Ikke-mrna@CLc d )
- ( Ikke@CLc d )
- ( Ikke-act@CLc d )
- ( Ikke:Tank:Tbk1@CLc d )
- ( Irf7-act-phos@CLc d Irf3-act-phos@CLc d )
- ( Irf3-act-phos@NUc d Irf7-act-phos@NUc d )
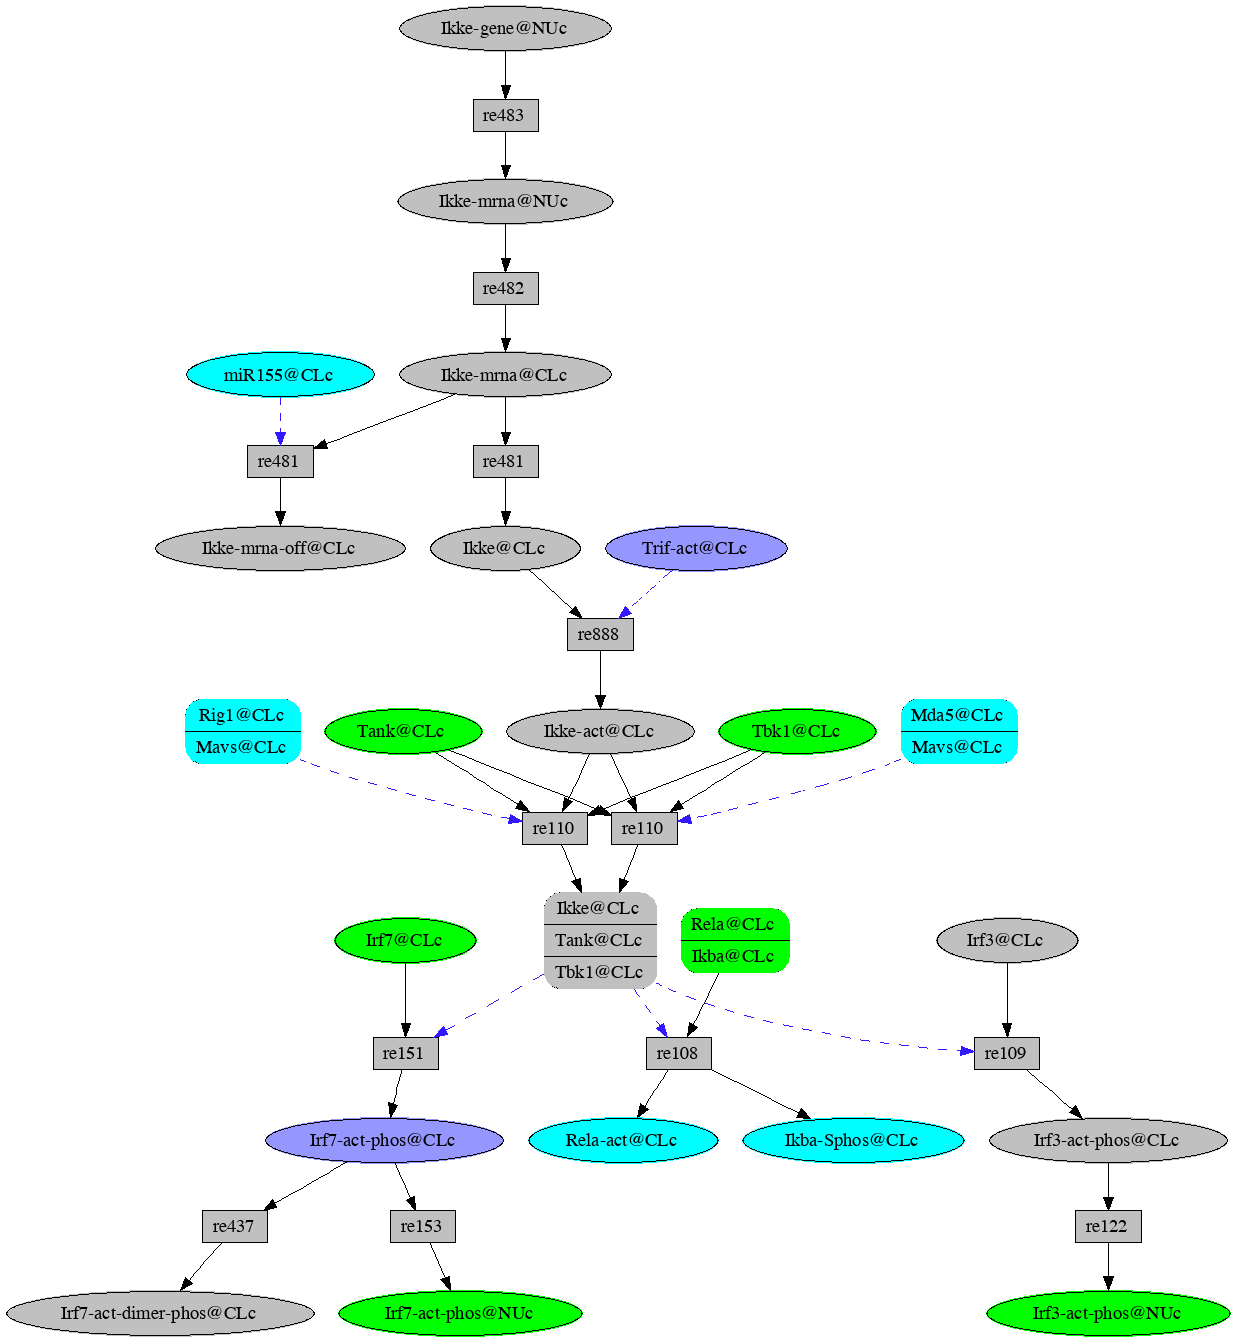
Network resulting from exploration downstreem from expression of the Ikke gene in VMac.
We see that in the VMac model, both Irf3 and Irf7 are activated
as outcomes of Ikke gene expression.
which then turn on the Ifna and Ifnb1 genes.
If you are curious, you can explore downward from these genes to
see what happens. The resulting graph is best visualized in
PLA not from an html page.
You may notice a micro RNA, miR155@CLc, showing up as a control
for rule re481. If you explore up from this occurrence you will
find the gene that codes for the micro RNA, Mir155@NUc.
Since PL has no naming conventions for micro RNAs, we used
the names provided in the XML with some upper/lower case
conventions to distinguish between the gene and the gene product.
Examining Phenotype subnets
Another way to explore VMac is bottom up, that is, starting with an endpoint or phenotype of interest and computing the relevant subnet. This is the subnet of all possible reactions that could contribute to reaching the phenotypic state. The source Macrophage Map classified a number of species (our occurrences) as phenotypes. We have just used the names from the XML, attempting to strip html coding, giving them location Sig (for signature) and not attempting any interpretation of the name.
As an example consider the M2 macrophage state. Macrophages are roughly categorized into to states of activation: M1 (classically activated) and M2(alternatively activated). M2 is also referred to as antiinflamatory. For more detail see the Wikipedia article on Macrophage polarization.
VMac has two M2 phenotypes: antiinflamationbrorM2@Sig and alternativeactivationbrofMphiorM2@Sig. To see the subnet for the first
- click on the selections tab on the information panel (lower right),
- check the goal box for antiinflamationbrorM2@Sig
- press the Subnet button in tool bar.
Since this is a large
subnet you will need to press the Render button in the tool bar
of the tab for this subnet to display the graph.
To see the subnet for the second M2 phenotype,
- go back to the graph2 (VMacDish) tab,
- choose selections,
- UNCHECK the goal box for antiinflamationbrorM2@Sig,
- check the goal box for alternativeactivationbrofMphiorM2@Sig,
- press the Subnet button.
- from the menu bar select the Compare menu,
- from this menu select the most recent graph before the current one (i.e. the graph for the relevant subnet for the first M2 phenotype).
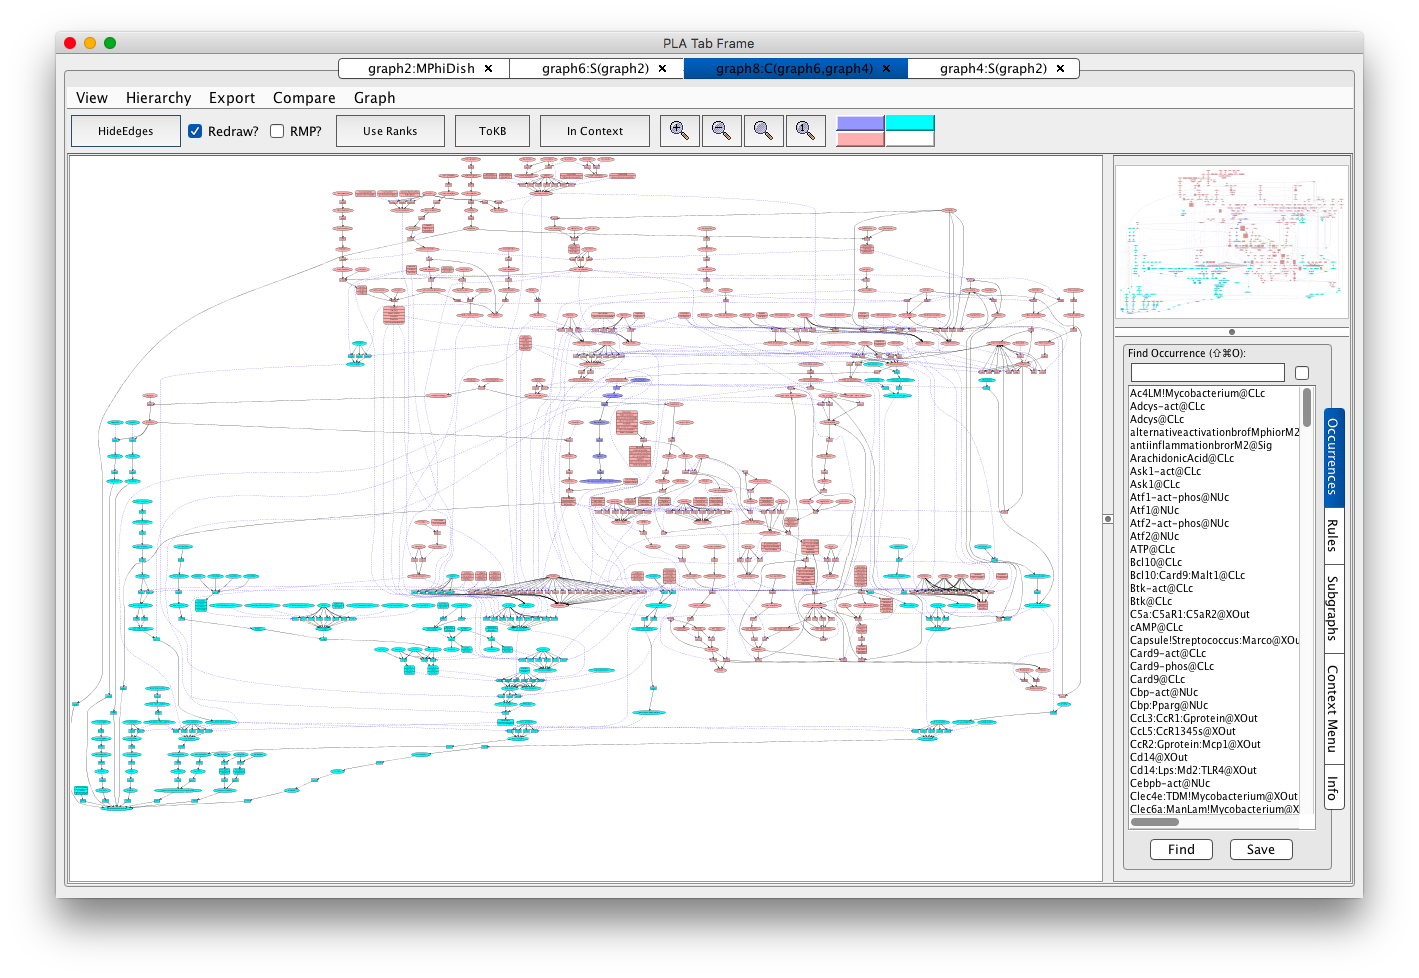
Full view of the comparison of M2 phenotype subnets in VMac. Each node is color coded according to which of the two compared graphs it came from: pink if both graphs, cyan if the first graph, and blue/lavendar if the second graph (from which the comparison was done).
There is just a small bit of blue/lavendar towards the middle. Using PLA look for Myc-gene@NUc. Induction of this gene by active Erks (rule re243) seems to be the alternative path. If you are curious about how this happens, click on rule re243, press Rule Evidence, and click on the pubmed id link. To findout why Myc@CLc leads to an M2 state, look at the evidence for rule re500.
Conclusions
The VMac network is the result of importing reactions from the Macrophage Map, converting names to the Pathway Logic controlled vocabulary, and identifying and fixing ill-formed rules (for example missing consumed occurrences, occurrences appearing both as consumed and control, ...), and normalizing representation to connect the network.
Now that you have your feet wet, so to speak, you can use your imagination to discover many more features in the VMac network.