Explaining responses to drugs using Pathway Logic
Introduction - why we are doing this
The SKMEL133Dish was made for the Phase 3 challenge of the DARPA Big Mechanism project. The challenge was to use our STM model to explain how a drug with a known mechanism of action caused the changes in protein expression and/or phosphorylation measured by Reverse Phase Protein Array (RPPA) using 112 antibodies. The data was from:
Korkut A, Wang W, Demir E, Aksoy BA, Jing X, Molinelli EJ, Babur O, Bemis DL, Onur Sumer S, Solit DB, Pratilas CA, Sander C. Perturbation biology nominates upstream-downstream drug combinations in RAF inhibitor resistant melanoma cells. Elife. 2015 Aug 18;4. PMID:26284497.
The cells used were exponentially growing SKMEL133 cells. The treatment was for 24 hours.
The data to be explained was provided in two formats:
- Average fold-change measurements using 3 biological replicates from one experiment based on an unreported number of technical replicates.
- Relative concentration values for each of the 3 biological replicates from one experiment and from 1 to 4 technical replicates.
Variance analysis showed that the noise from the provided technical replicates was larger than that of the biological replicates. This tells us that one technical replicate is not sufficient for realistic quantitation. Without quantitative information we resorted to using the fold-change measurements with a cutoff of 1.2x based on the number of changes that we would expect to see in response to what is known about the mechanism of action of the drugs. Phosphorylation changes were used only if the changes in total protein were also measured.
The drugs used in this analysis are:
Name |
PubChemCID |
Dose |
Targeted Occurrence |
AKTI12 |
10196499 |
10 uM |
Akts-act-phos!FSY-phos!KTF@CLc |
PD0325901 |
9826528 |
3 nM |
Mek1-act-phos!SMANS@CLc |
PLX4720 |
24180719 |
120 nM |
BrafV600E@CLc |
Temsirolimus |
23724530 |
0.6 nM |
Mlst8:Mtor-act:Raptor@CLc |
ZSTK474 |
11647372 |
1.2 uM |
Pi3k@CLi |
About the Model
The Pathway Logic (PL) STM model is a network of protein interactions and modifications which are used by the cell to transmit signals from its environment to the nucleus. The purpose of the model is to display the various ways the reactions can be connected in order to study the effects of removal/inhibition/mutation of proteins on downstream events. The reactions are derived from published experimental evidence and the problem of how to store and search the evidence became a project in itself. We eventually developed a "shorthand" language made up of modules that can be read by biologists, traced back to their source, and have enough structure to be interrogated computationally. We call those modules "datums".
About the Network
First we made an initial state that contained all components related to the protein changes demonstrated in the data. We did this by identifying all the rules in our rule set that would cause the modifications seen in the data. Then we identified rules that that would meet the requirements of the first set of rules. The last step was repeated until there were no more requirements to be met (backward collection). The initial state was created by determining the locations and modifications of all the entities in the collected rules that could not be created by any rules. SKMEL133 cells contain the constitutively active BrafV600E mutation and a homozygous deletion of Pten so we replaced Braf with BrafV600E and removed Pten. We added a rule specifying that BrafV600E is always active.
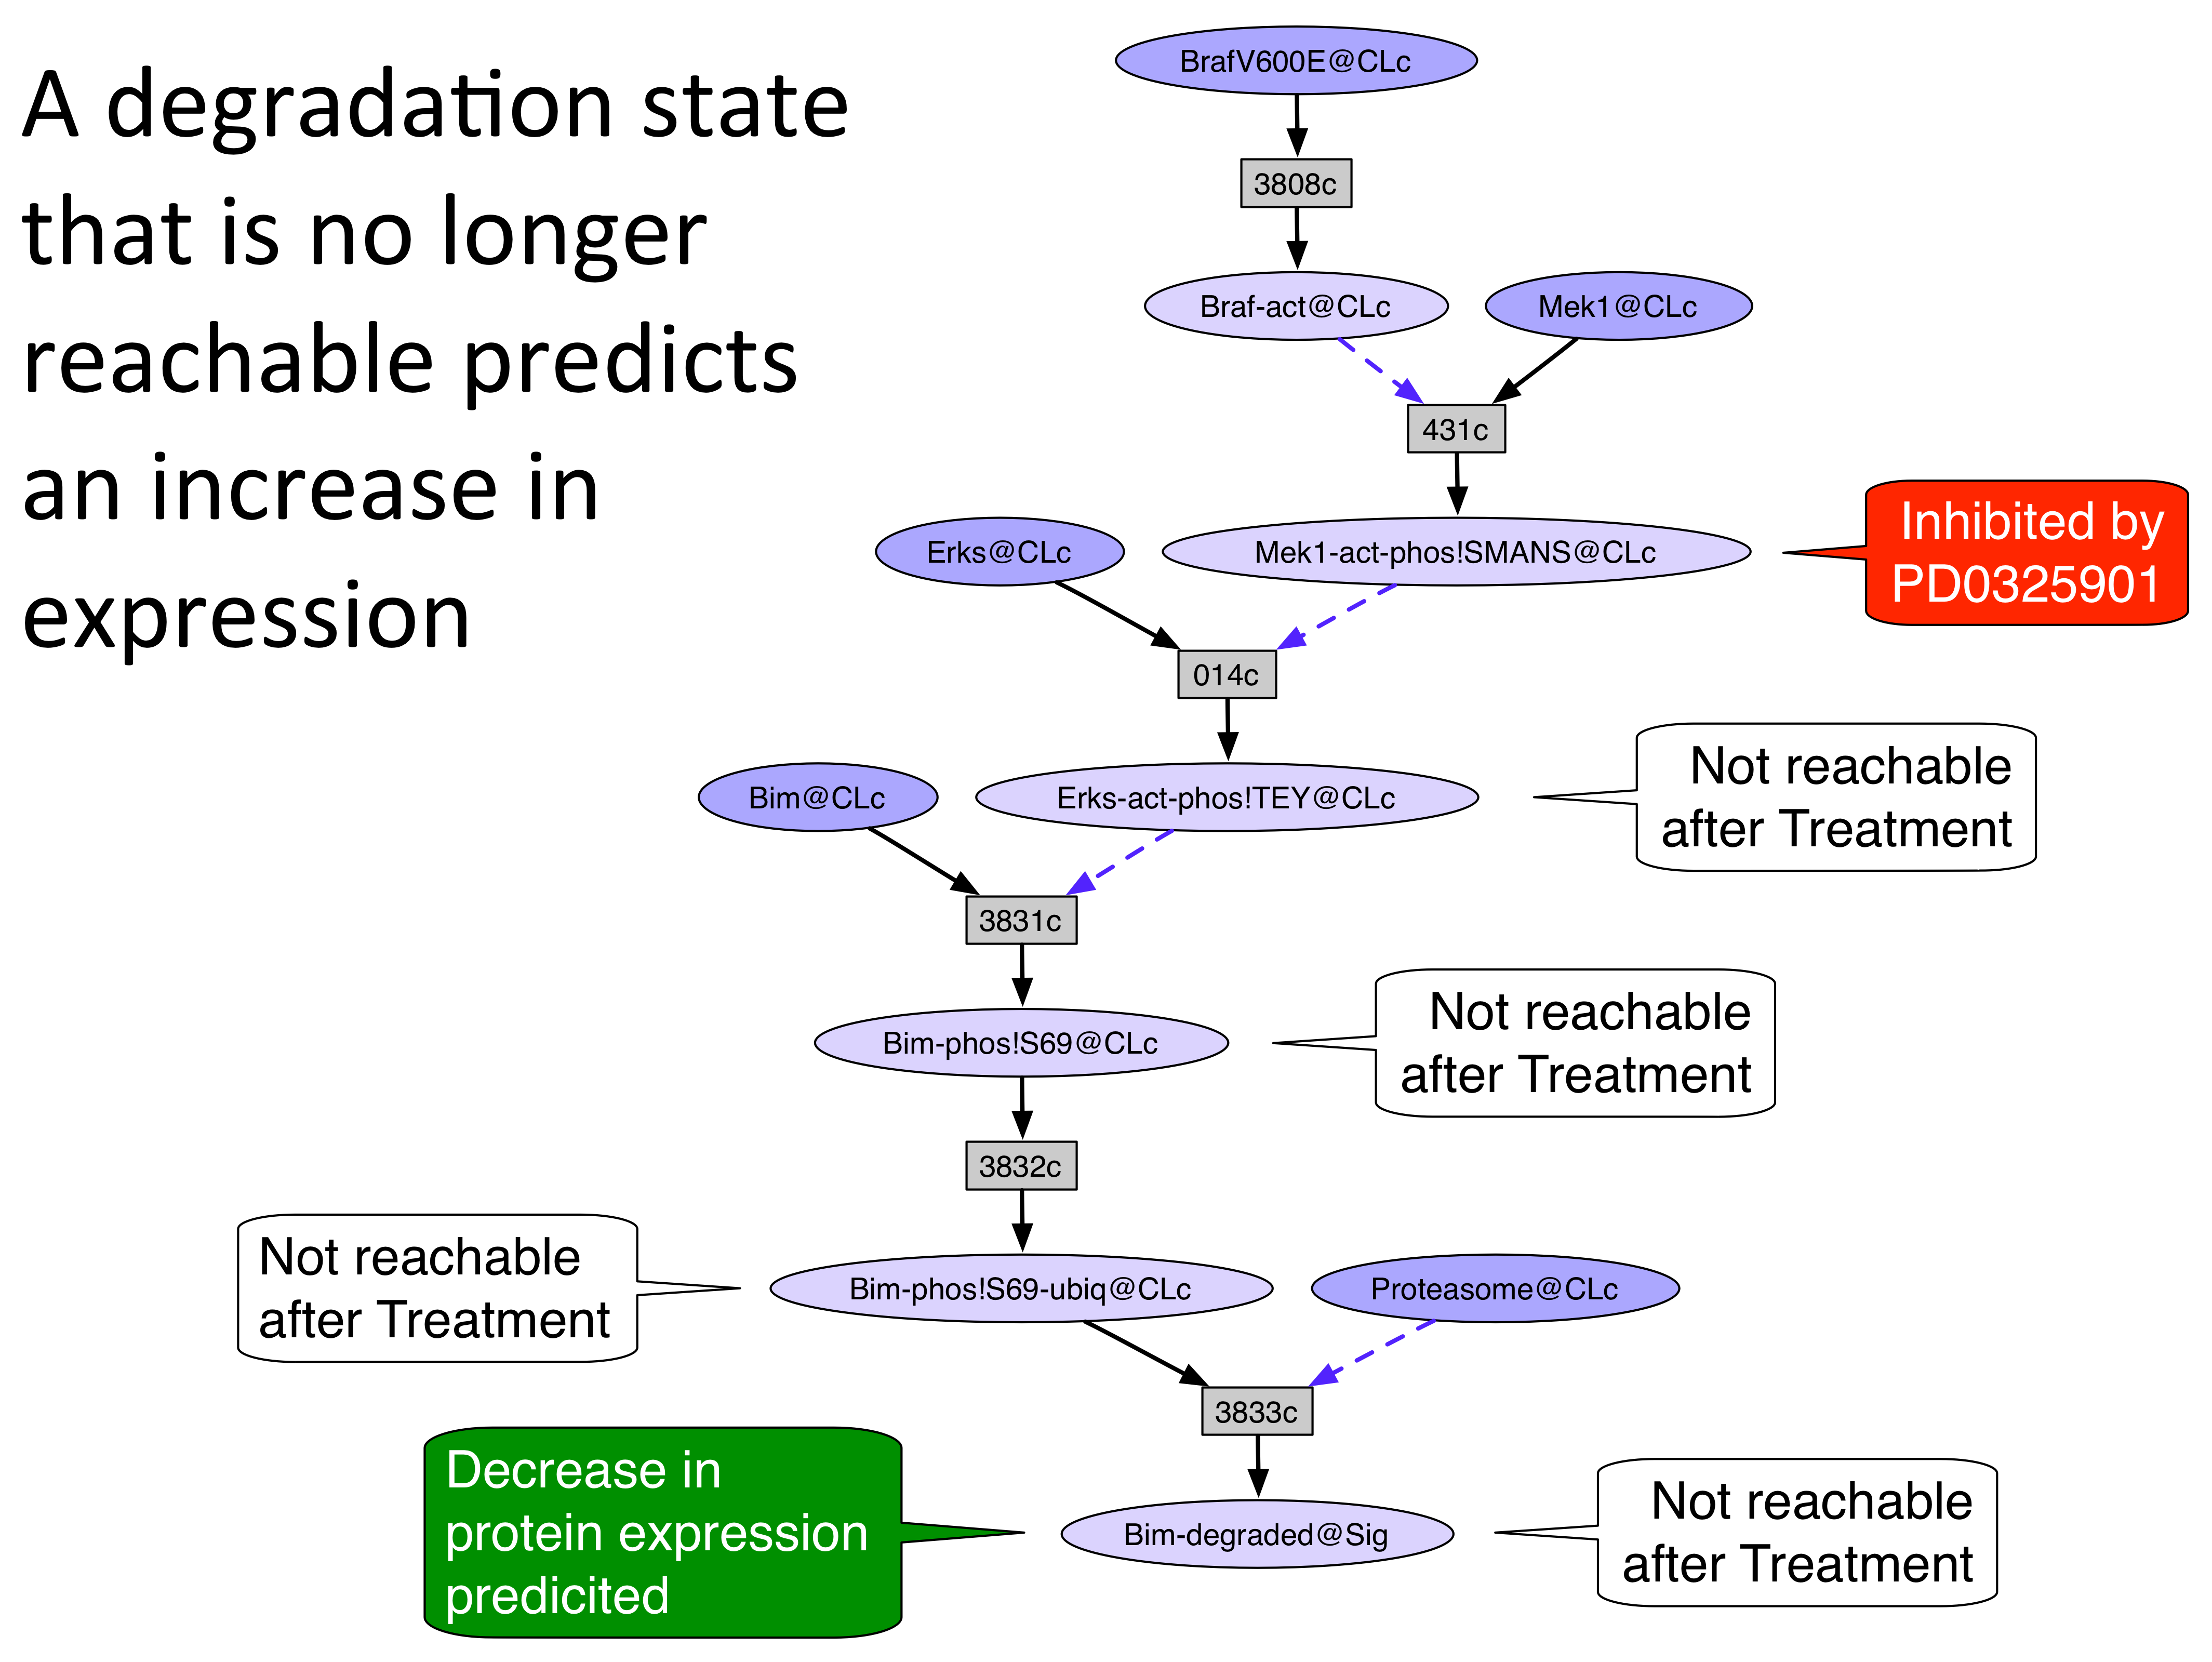
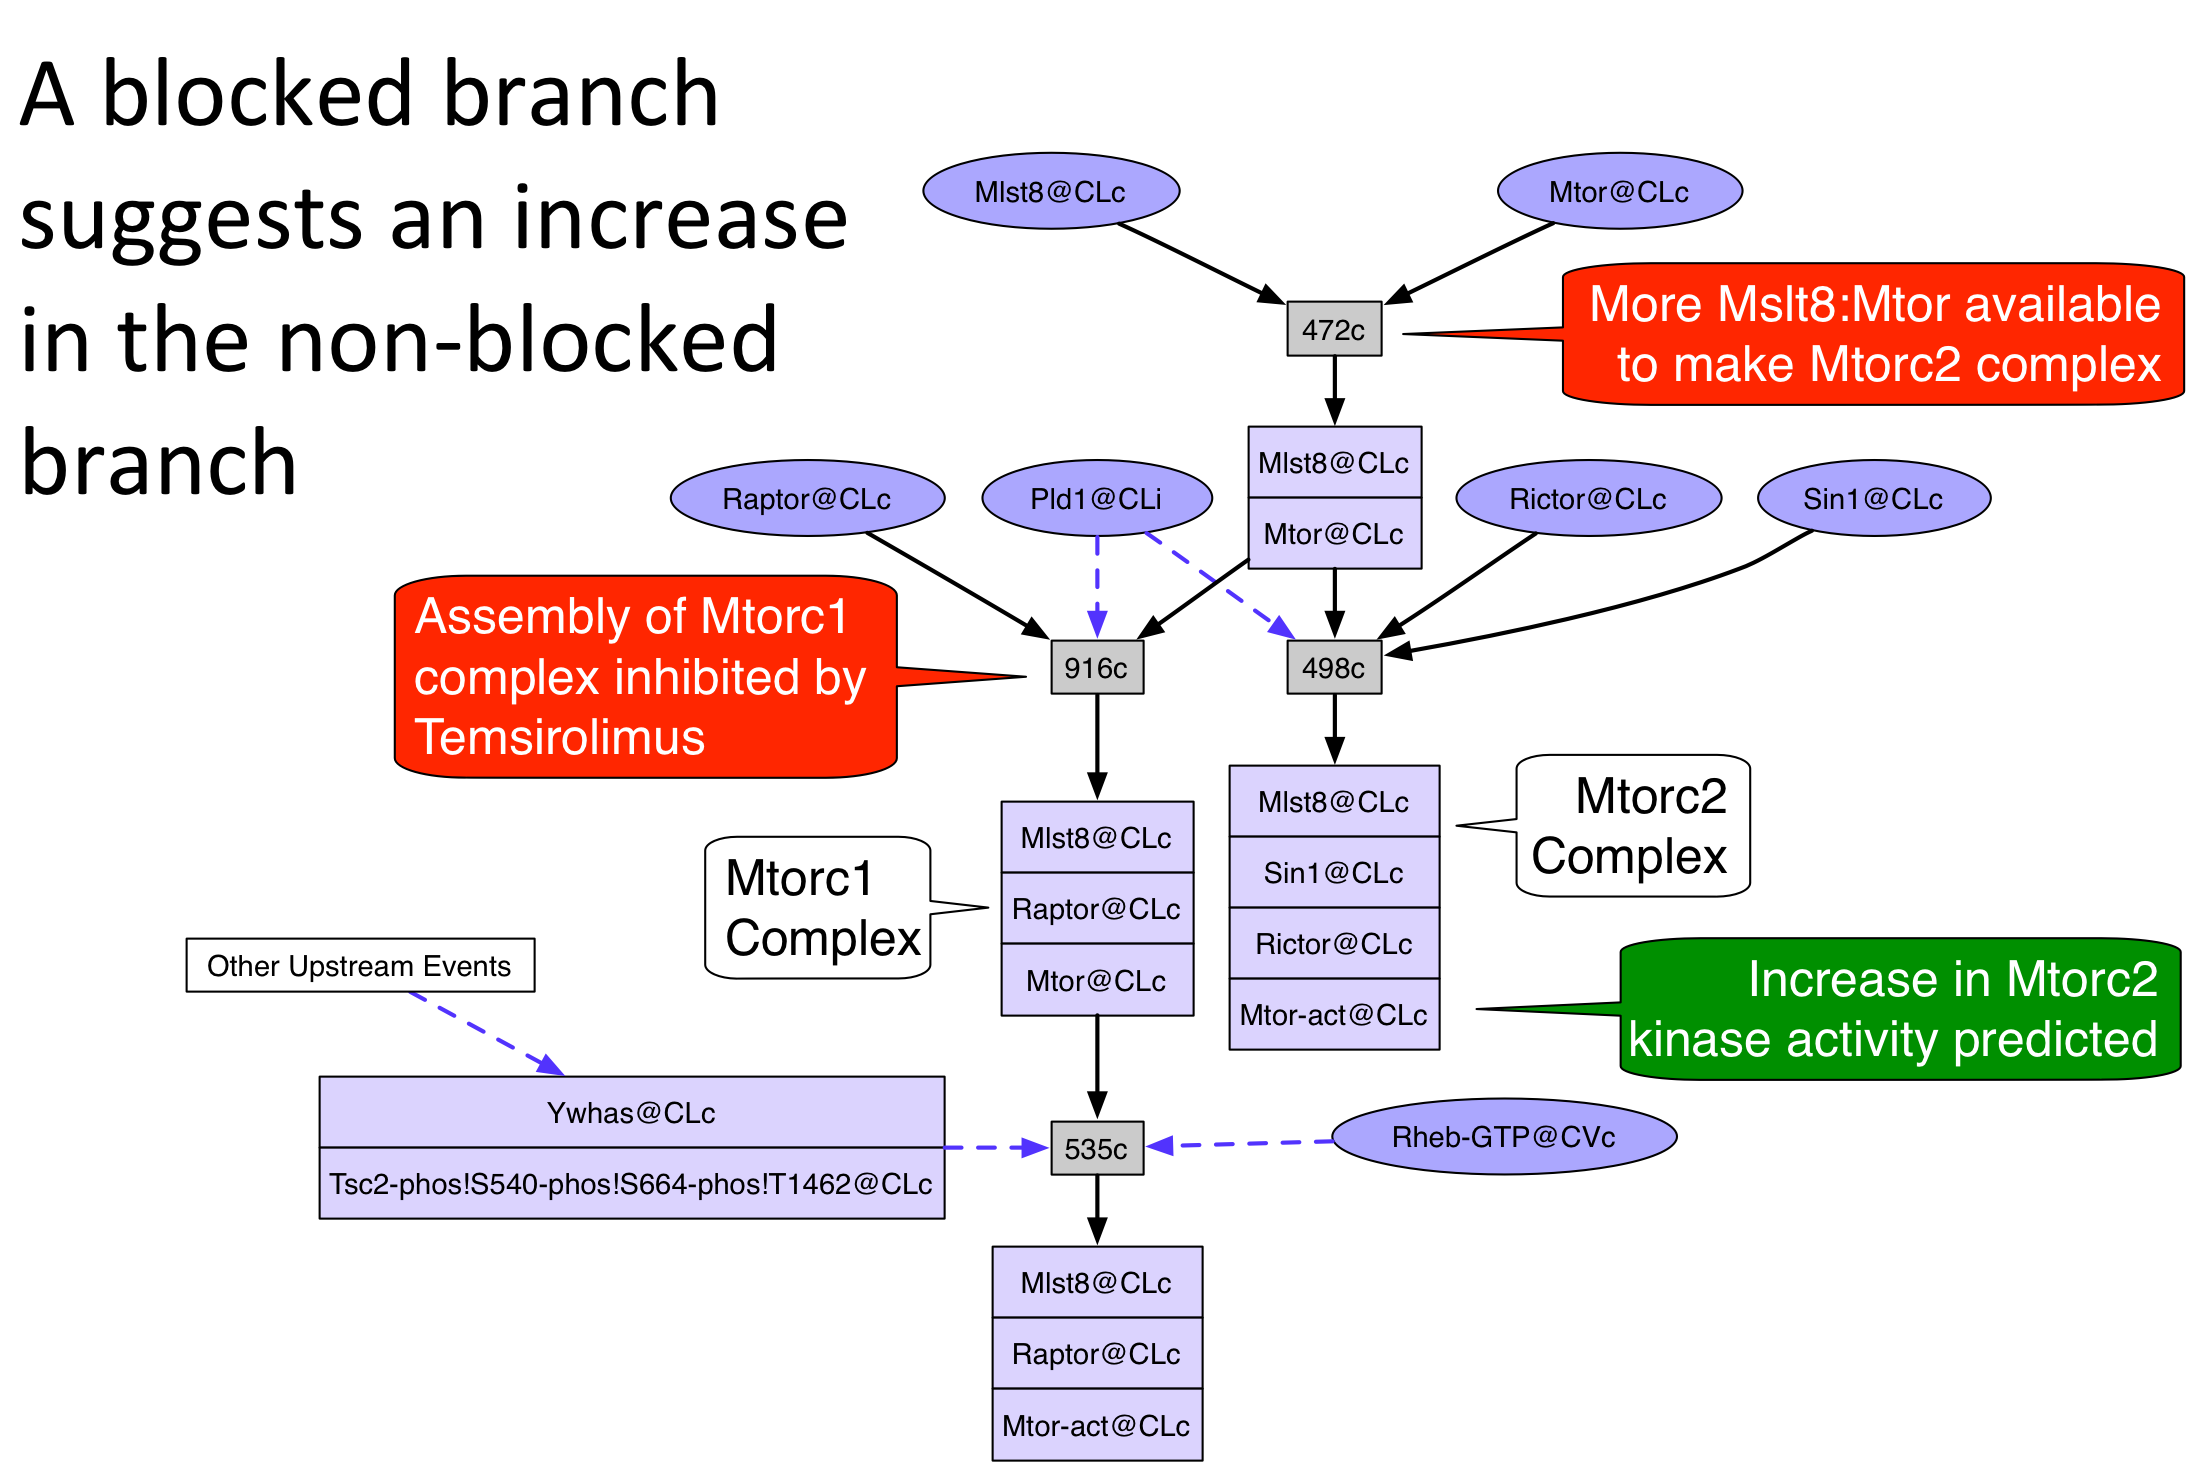
An unperturbed network was generated from the rule set and initial state by the Pathway Logic Assistant (PLA) using forward collection. The guided tour will demonstrate how to use the search and reachability functions of Pathway Logic to explain how the 5 drugs caused some of the changes in protein expression and phosphorylation observed in the data. In general, the occurrence inhibited by a drug will be removed (or "avoided") from the network and the resulting network will be analyzed for events that are not longer reachable. The following pictures illustrate three ways to reason about the change in reachability when a drug target is avoided.
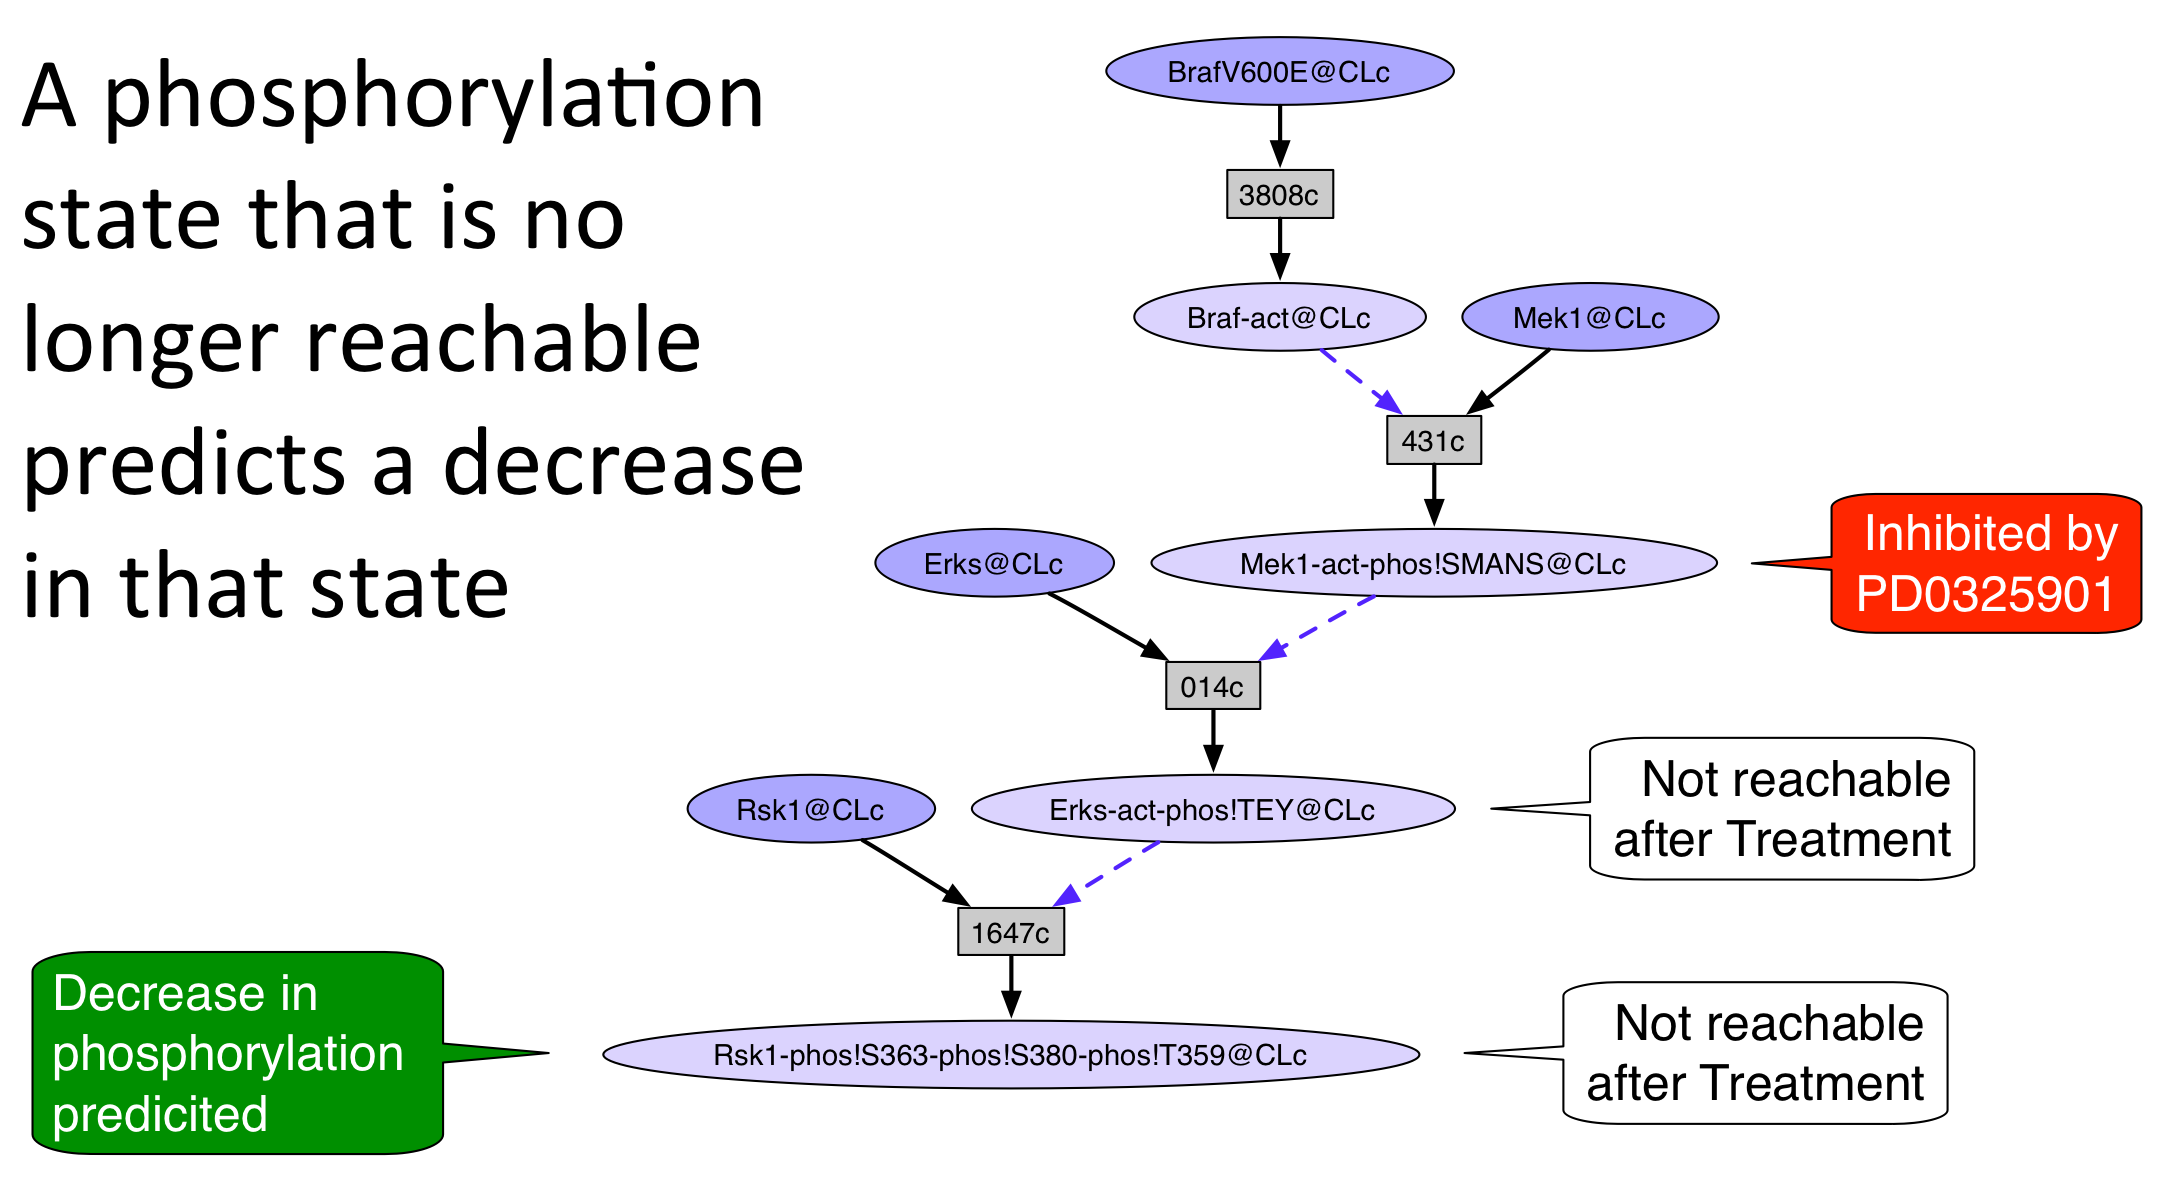
Double click on any image to enlarge it, single click to return to original size
Guided Tour: Using PLA to explain the the effects of drugs on components of signaling pathways in SKMEL133 cells.
Start the online demo launcher by clicking here and then launch the SKMEL133 model by selecting it, and pressing the Launch button (for security issues see the online page for more details). To learn more about using PLA and about PL models check out the SmallKB and STM7 models (and their guided tours) in the online collection via the launcher.
When PLA starts up, a knowledge base manager window (title: PLA KBManager) appears in the upper left corner of your screen. The KBManager displays a list of available knowledge bases (rule sets). "RKB" is selected by default and will be highlighted in blue.
Start by selecting a predefined dish: press the "Select Dish" button on the right side of the KBManager window. This produces a menu with two options: "Edit" and "PreDefined". Select (click on) "PreDefined". This produces a (sub)menu with a list of pre-defined dishes. Select "SKMEL133Dish" (by clicking on the corresponding menu item).
Shortly a PLA viewer window with tab titled "graph2:SKMEL133Dish" will appear on your screen displaying the Unperturbed Network (the network of reactions reachable starting from the occurrences in SKMEL133Dish). [Note that the graph numbers in titles may differ if you have created graphs or nets in addition to those discussed in the demo. This is fine.]
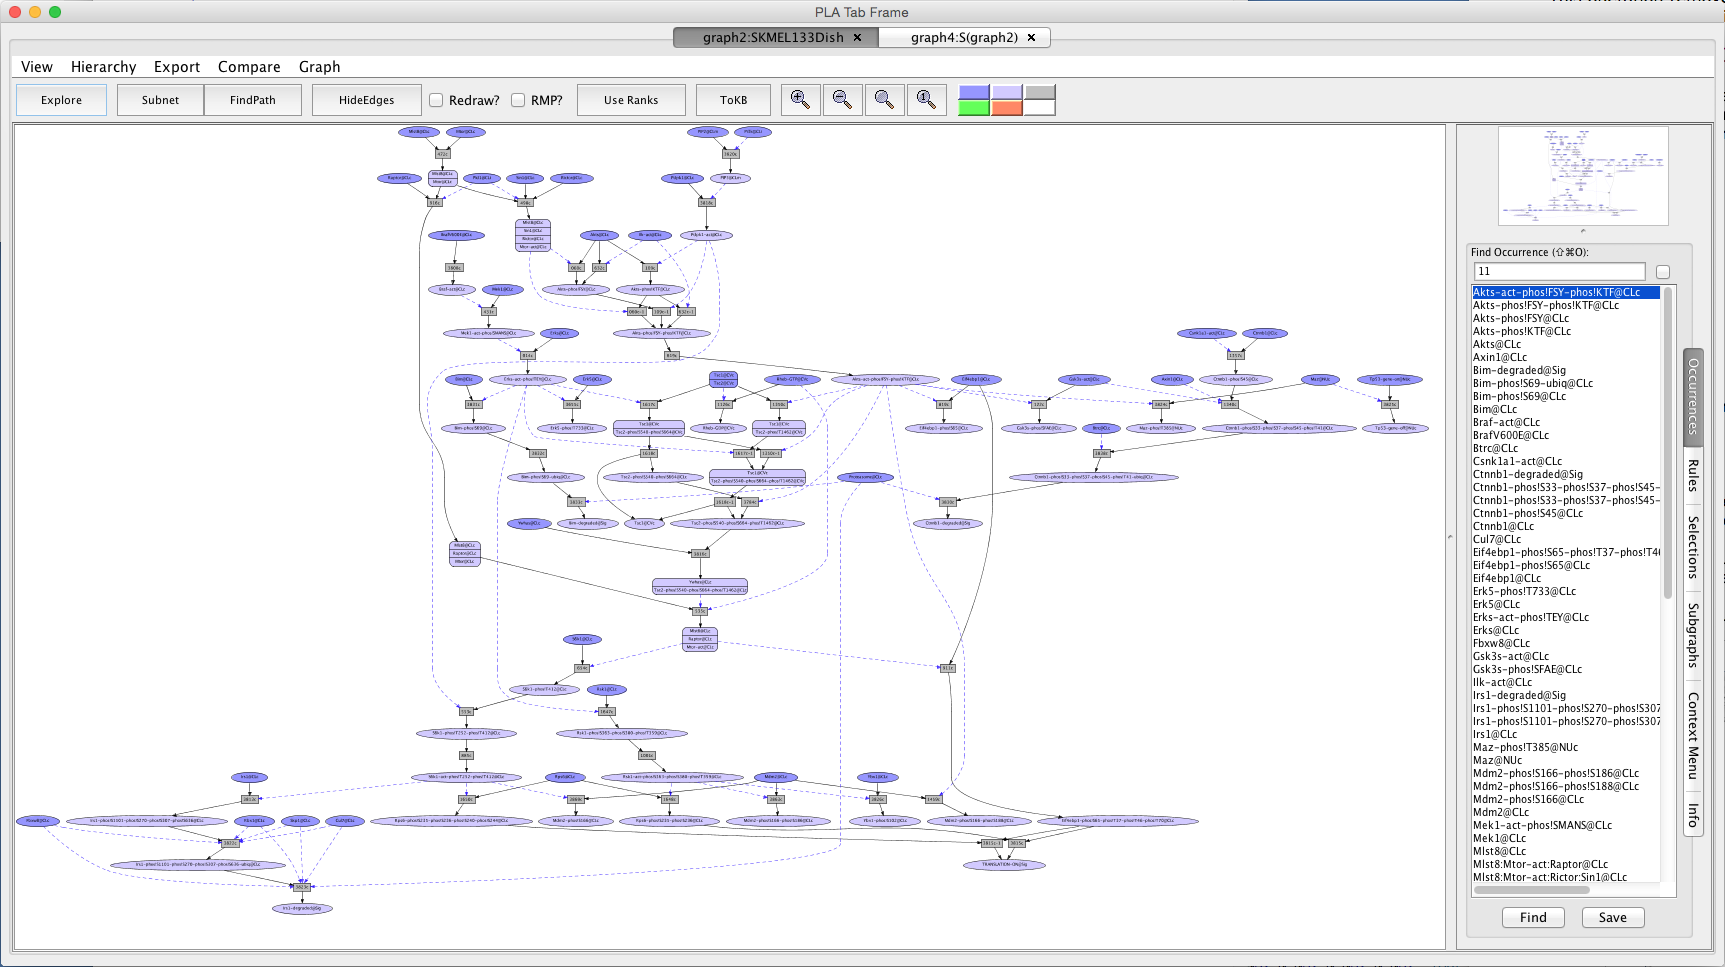
Screen shot of the Unperturbed Network
A network of reactions is displayed as a graph with two kinds of nodes. Ovals represent occurrences (proteins or chemicals in a specific state and location). For example the oval labeled Braf-act@CLc represents the kinase active protein Braf located in the cytoplasm (@CLc). Clicking on an occurrence opens the Context Menu for that occurence. Clicking on 'About Occurrence' in the Context Menu provides information about the occurrence as well as links to the UniProt record for proteins and HGNC for the genes.
The modifications used in the network are:
Modification |
Description |
act |
is only used for kinases. It indicates that the kinase is in a state capable of phosphorylating it's substrates. |
phos!site |
means that the entity is phosphorylated on a particular site. |
ubiq |
means that the entity is ubiquitinated. |
GDP |
means that the entity is bound to GDP. |
GTP |
means that the entity is bound to GTP. |
on |
is only used for genes. It indicates that the gene is producing mRNA. |
off |
is only used for genes. It indicates that the gene is not producing mRNA. |
The locations used in the network are:
Location |
Description |
CLc |
Cytoplasm |
CLi |
Stuck to the inside of the plasma membrane or bound to another protein which is in the CLi or bound to the inner side of a protein in the CLm |
CLm |
Plasma Membrane |
CVc |
Stuck to the cytoplasmic side of the membrane of a cytoplasmic vesicle or bound to another protein which is in the CVc or bound to the cytoplasmic side of a protein in the CVm |
Nuc |
Nucleus |
The location Sig (Signature) is a hack used to point out a cellular process (such as "TRANSLATION-ON@Sig") or the disappearance of an entity (such as "Bim-degraded@Sig").
The STM model uses the term 'family' for groups of proteins that cannot be differentiated by antibodies. For example, the anti-Akt antibody (CST#4691) used in this study detects Akt1, Akt2, and Akt3. We cannot determine whether the increase in the level of protein-exp is due to one and/or two and/or three of the Akts. Thus clicking on the occurrence "Akts@CLc" and the button "About Occurrence" will tell you that Akts refers to the family with the members Akt1, Akt2, and Akt3. Similarly, the antibody used to detect Akt1-phos!S473 (CST#9271) also recognizes Akt2-phos!S474 and Akt3-phos!S472. We use a site code to represent the corresponding residues in all three proteins.
The site codes used in the network are:
Site Code |
Refers to |
and/or |
and/or |
Akts-phos!FSY |
Akt1-phos!S473 |
Akt2-phos!S474 |
Akt3-phos!S472 |
Akts-phos!KTF |
Akt1-phos!T308 |
Akt2-phos!T309 |
Akt3-phos!S307 |
Ampkas-phos!LRtSC |
Ampka1-phos!T183 |
Ampka2-phos!T172 |
|
Gsk3s-phos!SFAE |
Gsk3a-phos!S21 |
Gsk3b-phos!S9 |
|
Mek12s-phos!SMANS |
Mek1-phos!S218-phos!S222 |
Mek2-phos!S222-phos!S226 |
Darker colored ovals represent occurrences in the initial state (the selected dish when the network is generated by choosing a dish). Lighter colored ovals represent potential states/locations of these components.
Rectangles represent rules. The label in a rectangle is its (abbreviated) identifier in the knowledge base. The complete identifier and a list of inputs and outputs can be displayed in the Info window by first clicking on the rule and then clicking on 'About rule' in the Context Menu. A link to the evidence page for the rule can be displayed in the Info window by clicking on 'Rule Evidence' in the Context Menu. Details on how to read a datum can be found here .
Solid arrows from an occurrence to a rule indicate that the occurrence is a reactant (rule input). Solid arrows from a rule to an occurrence indicate that the occurrence is a product (rule output). Dashed arrows from an occurrence to a rule indicate that the occurrence is a controller; that is, it is necessary for the reaction to take place but is not changed by the reaction. The graph can been simplified by checking the Redraw? box followed by clicking on the 'HideEdges' button in the tool bar. This operation removes redundant edges. Meaning: if there are edges connecting A -> B -> C and A -> C, then the edge leading from A to C will be removed, as it is logically implied by the other two edges. You can force the graph layout to respect rule ranks ("must fire before" order) by pressing the "Use Ranks" button in the tool bar.
AktI12 PubChemCID 10196499
AktI12 is a reversible allosteric inhibitor of Akt1 and Akt2 which prevents the conformational change that permits phosphorylation and activation [17563061]. The effects of treating SKMEL133 cells with 10 uM AktI12 for 24 hours were:
Occurrence |
Change |
Explained? |
Cav1 |
increased |
no |
Chek2-phos!T68 |
increased |
no |
Cox2 |
increased |
no |
CyclinB1 |
decreased |
no |
Eif4ebp1-phos!S65 |
decreased |
yes |
Fn1 |
increased |
no |
Gsk3s-phos!SFAE |
decreased |
yes |
Igfbp2 |
increased |
no |
Irs1 |
increased |
yes |
Pai1 |
increased |
no |
Plk1 |
decreased |
no |
Rps6-phos!S235 |
decreased |
yes |
Rps6-phos!S240 |
decreased |
yes |
S6k1-phos!T412 |
decreased |
yes |
Tp53 |
increased |
no |
Tsc2-phos!T1462 |
decreased |
yes |
A "no" in the Explained? column indicates that the occurrence is either not in the model or is unreachable from the initial state. A "yes" means that the occurrence appears in the unperturbed model and its response to the drug is explained by one of the three reasoning schemes shown above.
- Select the "Occurrences" tab in the lower right panel.
- Type Akts in the Find Occurrence window.
- Press on the Tab key until "Akts-act-phos!FSY-phos!KTF@CLc" is highlighted in the list below.
- Click on the Find button. This will locate and highlight the requested occurrence node in the main view window.
- Click on this node to open the context tab in the lower right panel.
- Click on the "Avoid occ" button in the context window. The node will turn red.
- Press the button labeled "Subnet" in the tool bar. Shortly a new tab will appear displaying a graph representing a subnet of the original graph with all of the occurrences that require "Akts-act-phos!FSY-phos!KTF@CLc" removed (graph4:S(graph2)).
- Press the button labeled "In Context". This makes a copy of the unperturbed network with the unreachable occurrences grayed out.
- The graph can be exported as an image (png, jpg, xdot, eps, or svg) using "Export/Export Image.." menu and decorated for presentations using standard markup applications such as PowerPoint or Graffle. An example giving a visual explanation of drug effects on elements of the PL SKMEL133 model is provided below.
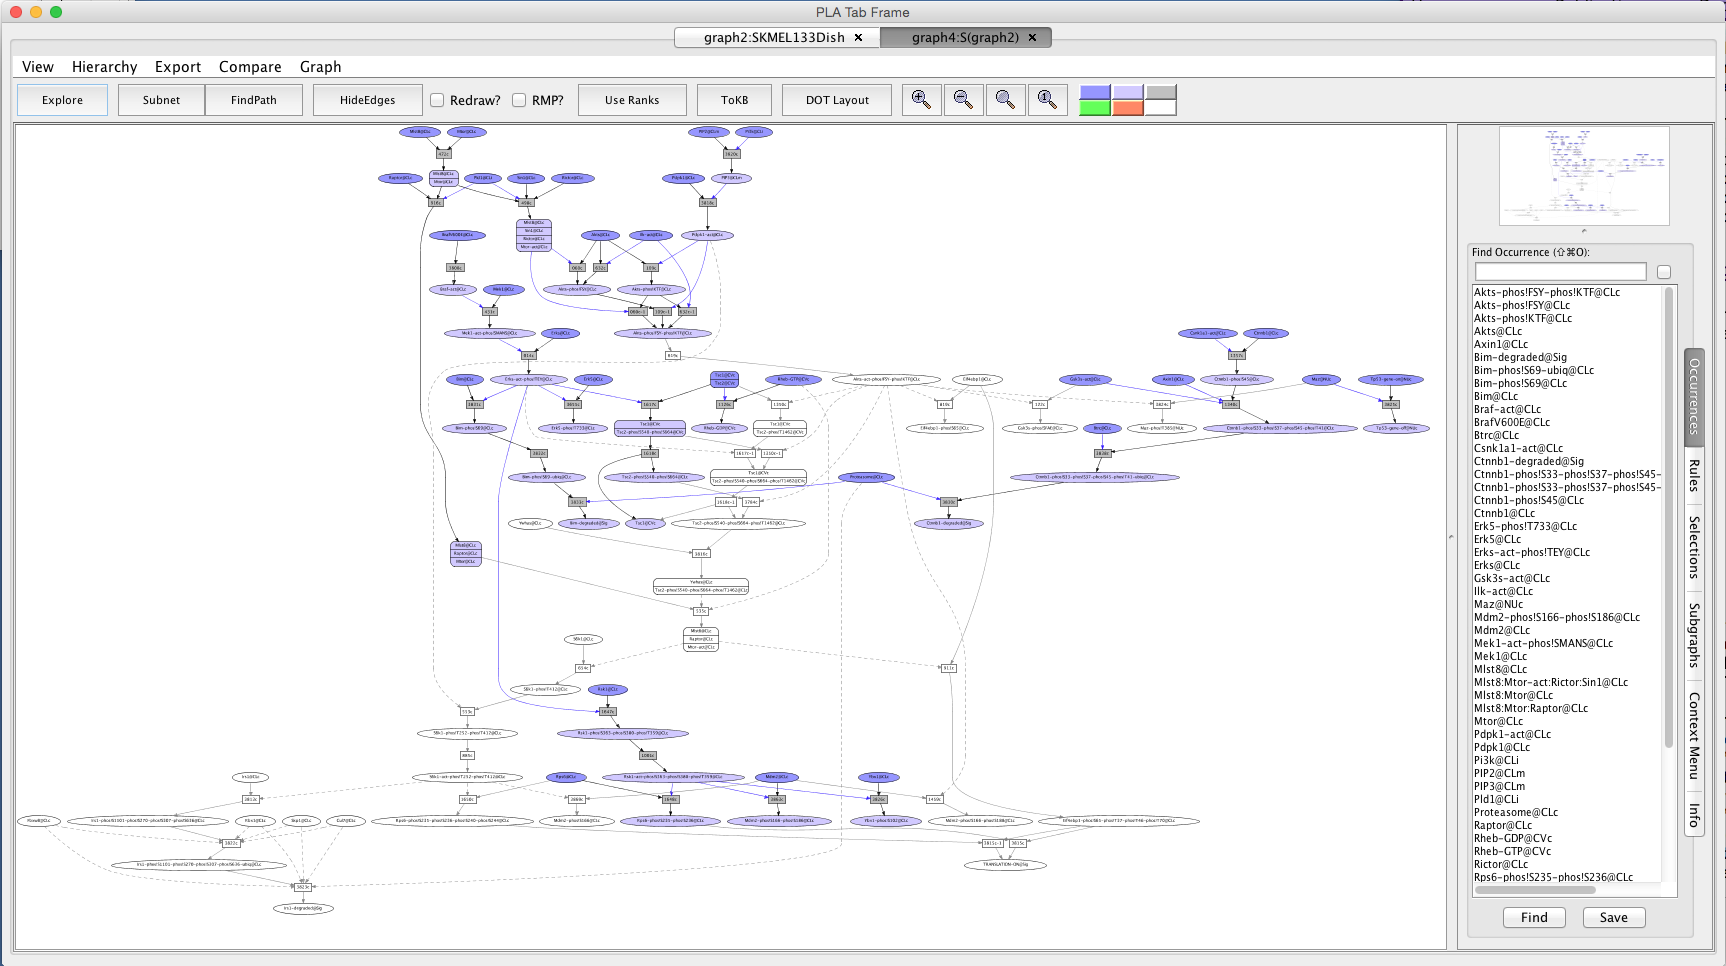
Screen shot of the network after perturbation with AktI12
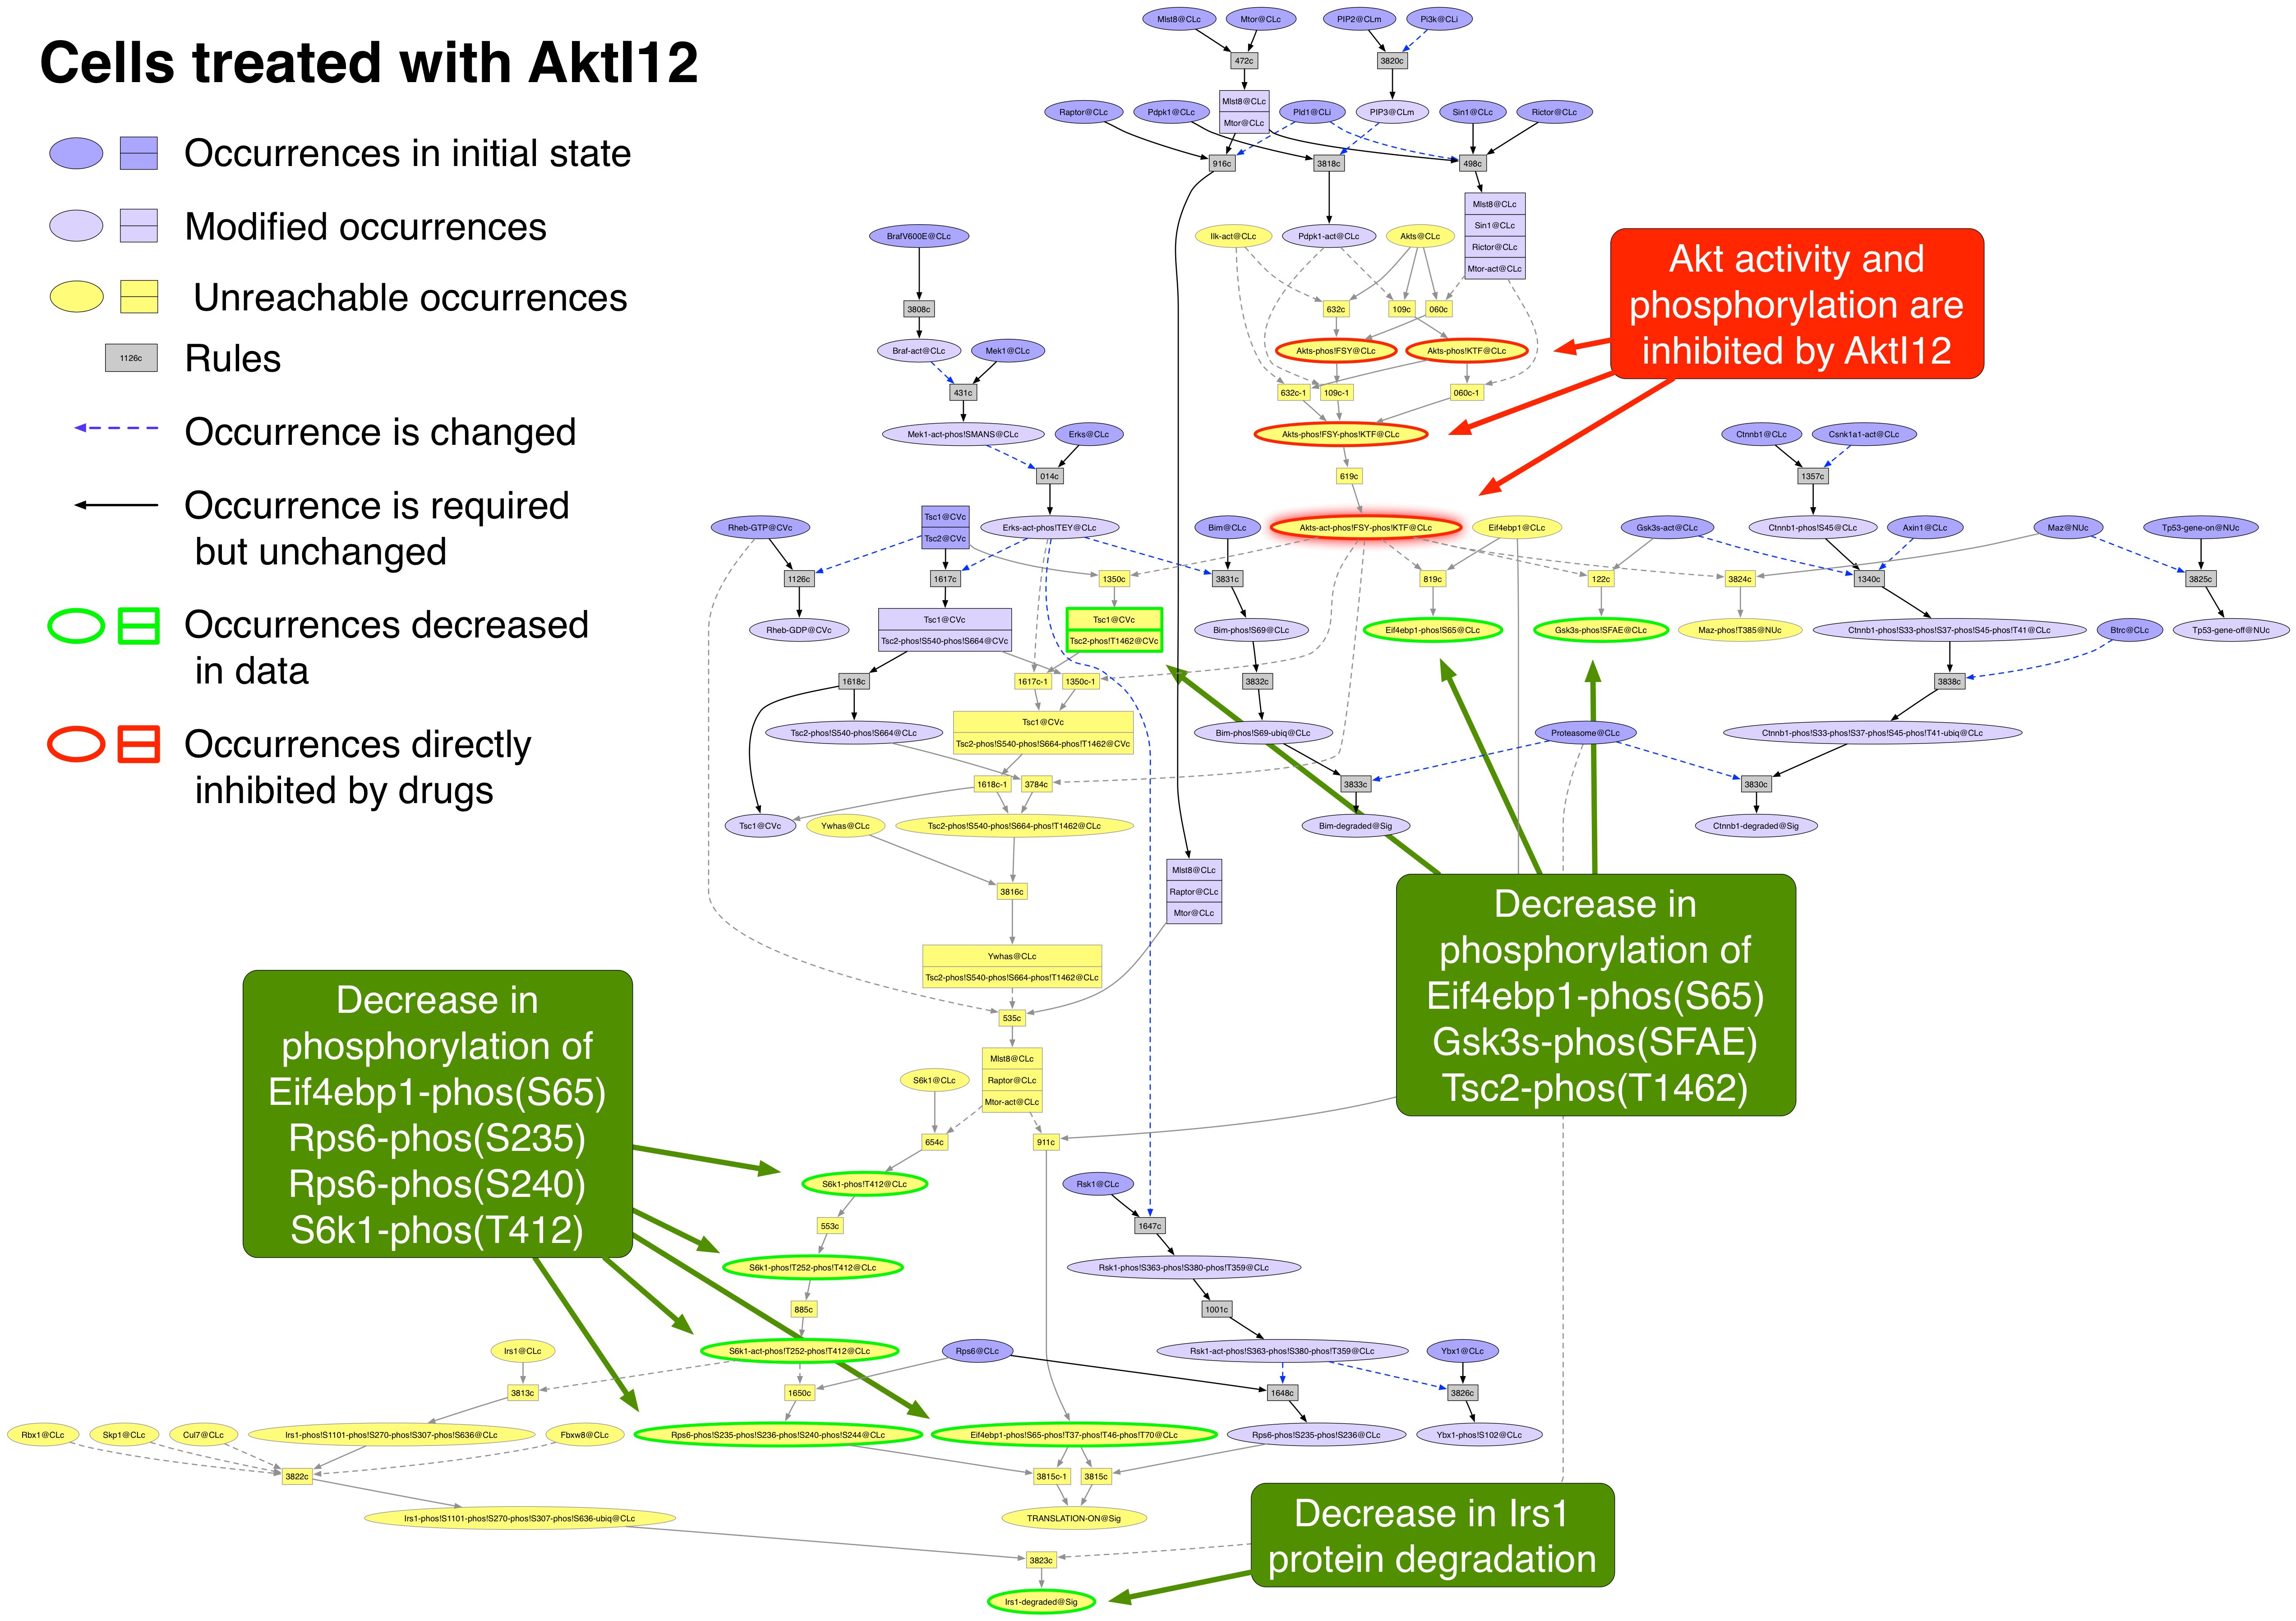
Exported image of AktI12 perturbation decorated in Graffle
PD0325901 PubChemCID 9826528
PD0325901 is an allosteric inhibitor of Mek1 and Mek2 kinase activity [25435214].
Occurrence |
Change |
Explained? |
Akts-phos!FSY |
increased |
no |
Akts-phos!KTF |
increased |
no |
Ampkas-phos!LRtSC |
increased |
no |
Bim |
increased |
yes |
Cox2 |
decreased |
no |
Ctnnb1 |
increased |
no |
CyclinB1 |
decreased |
no |
CyclinD1 |
decreased |
no |
Foxo3 |
increased |
no |
Myc |
decreased |
no |
Pai1 |
decreased |
no |
Plk1 |
decreased |
no |
Rb1-phos!S608-phos!S807-phos!S811 |
decreased |
no |
Rps6-phos!S235 |
decreased |
yes |
Rps6-phos!S240 |
decreased |
yes |
S6k1-phos!T412 |
decreased |
yes |
Stat5a |
increased |
no |
Tp53 |
increased |
no |
Ybx1-phos!S102 |
decreased |
yes |
- Return to the unperturbed network by clicking on the "graph2:SKMEL133Dish" tab.
- Select the "Selections" tab in the lower right panel.
- Click on "Reset All Selections". The red node "Akts-act-phos!FSY-phos!KTF@CLc" will revert to blue to show that it is no longer avoided.
- Select the "Occurrences" tab in the lower right panel.
- Type "Mek1" in the Find Occurrence window.
- Press on the Tab key until "Mek1-act-phos!SMANS@CLc" is highlighted in the list below.
- Click on the Find button. This will locate and highlight the requested occurrence node in the main view window.
- Click on this node to open the context tab in the lower right panel.
- Click on the "Avoid occ" button in the context window. The node will turn red.
- Press the button labeled "Subnet" in the tool bar. Shortly a new tab will appear displaying a graph representing a subnet of the original graph with all of the occurrences that require "Mek1-act-phos!SMANS@CLc" removed.
- Press the button labeled "In Context". This makes a copy of the unperturbed network with the unreachable occurrences grayed out.
- The graph can be exported as an image (png, jpg, xdot, eps, or svg) using "Export/Export Image.." menu and decorated for presentations using standard markup applications such as PowerPoint or Graffle. An example is provided below.
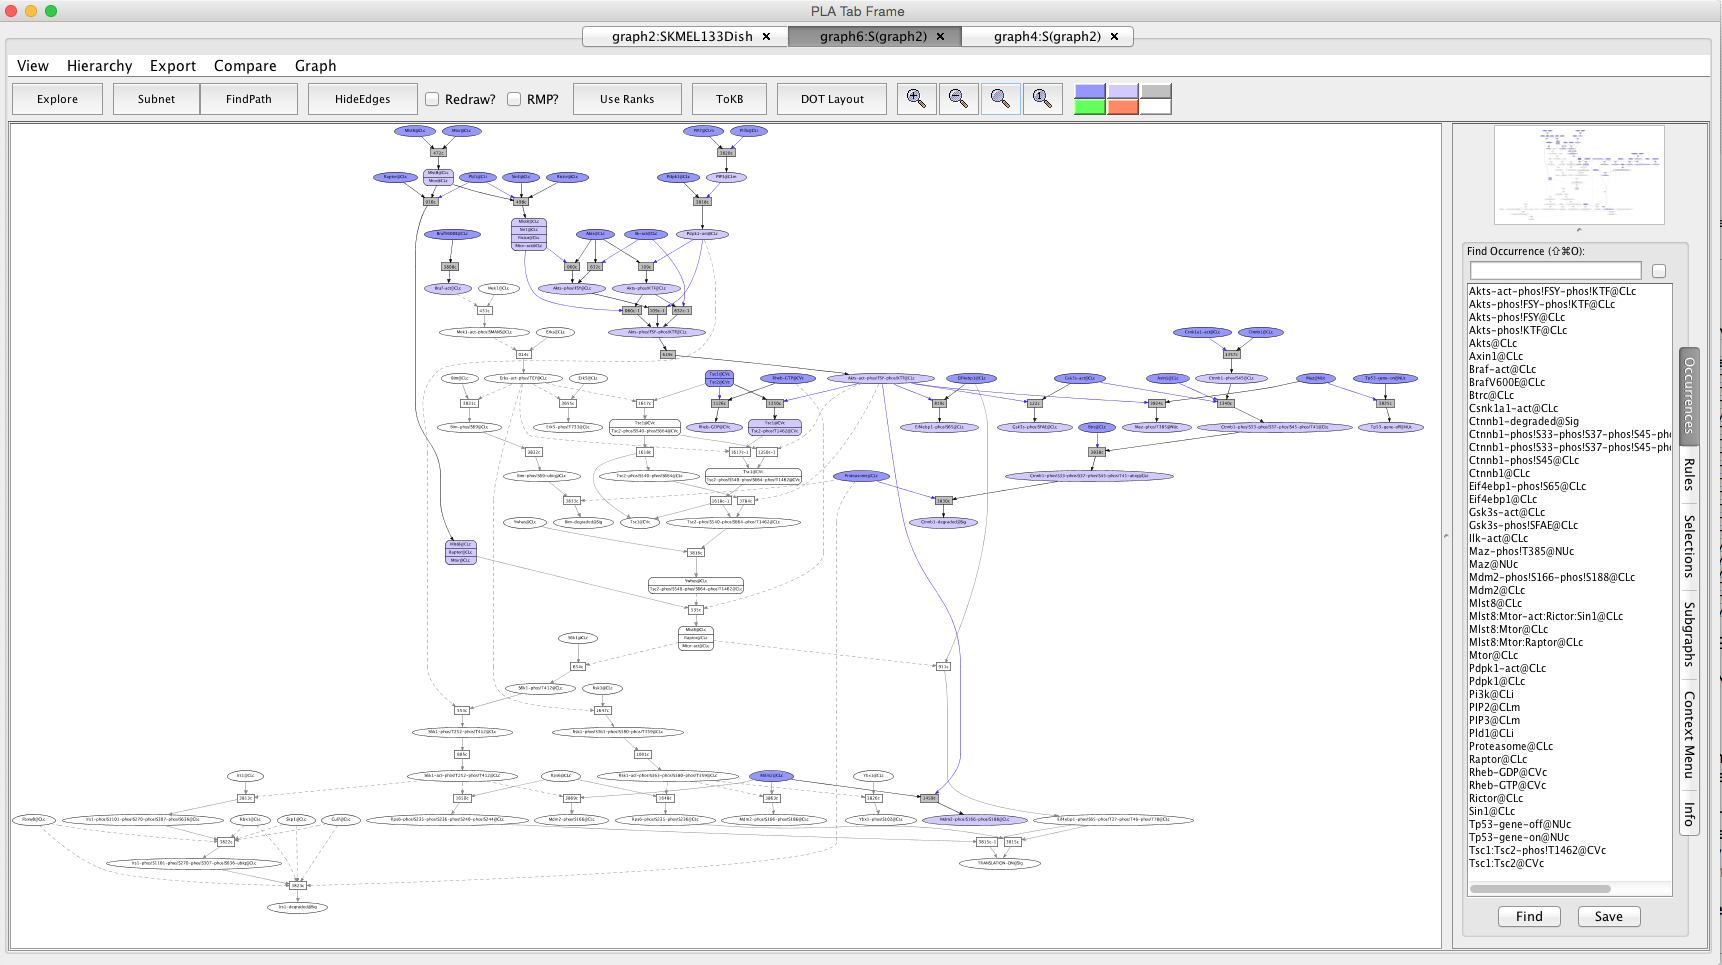
Screen shot of the network after perturbation with PD325901
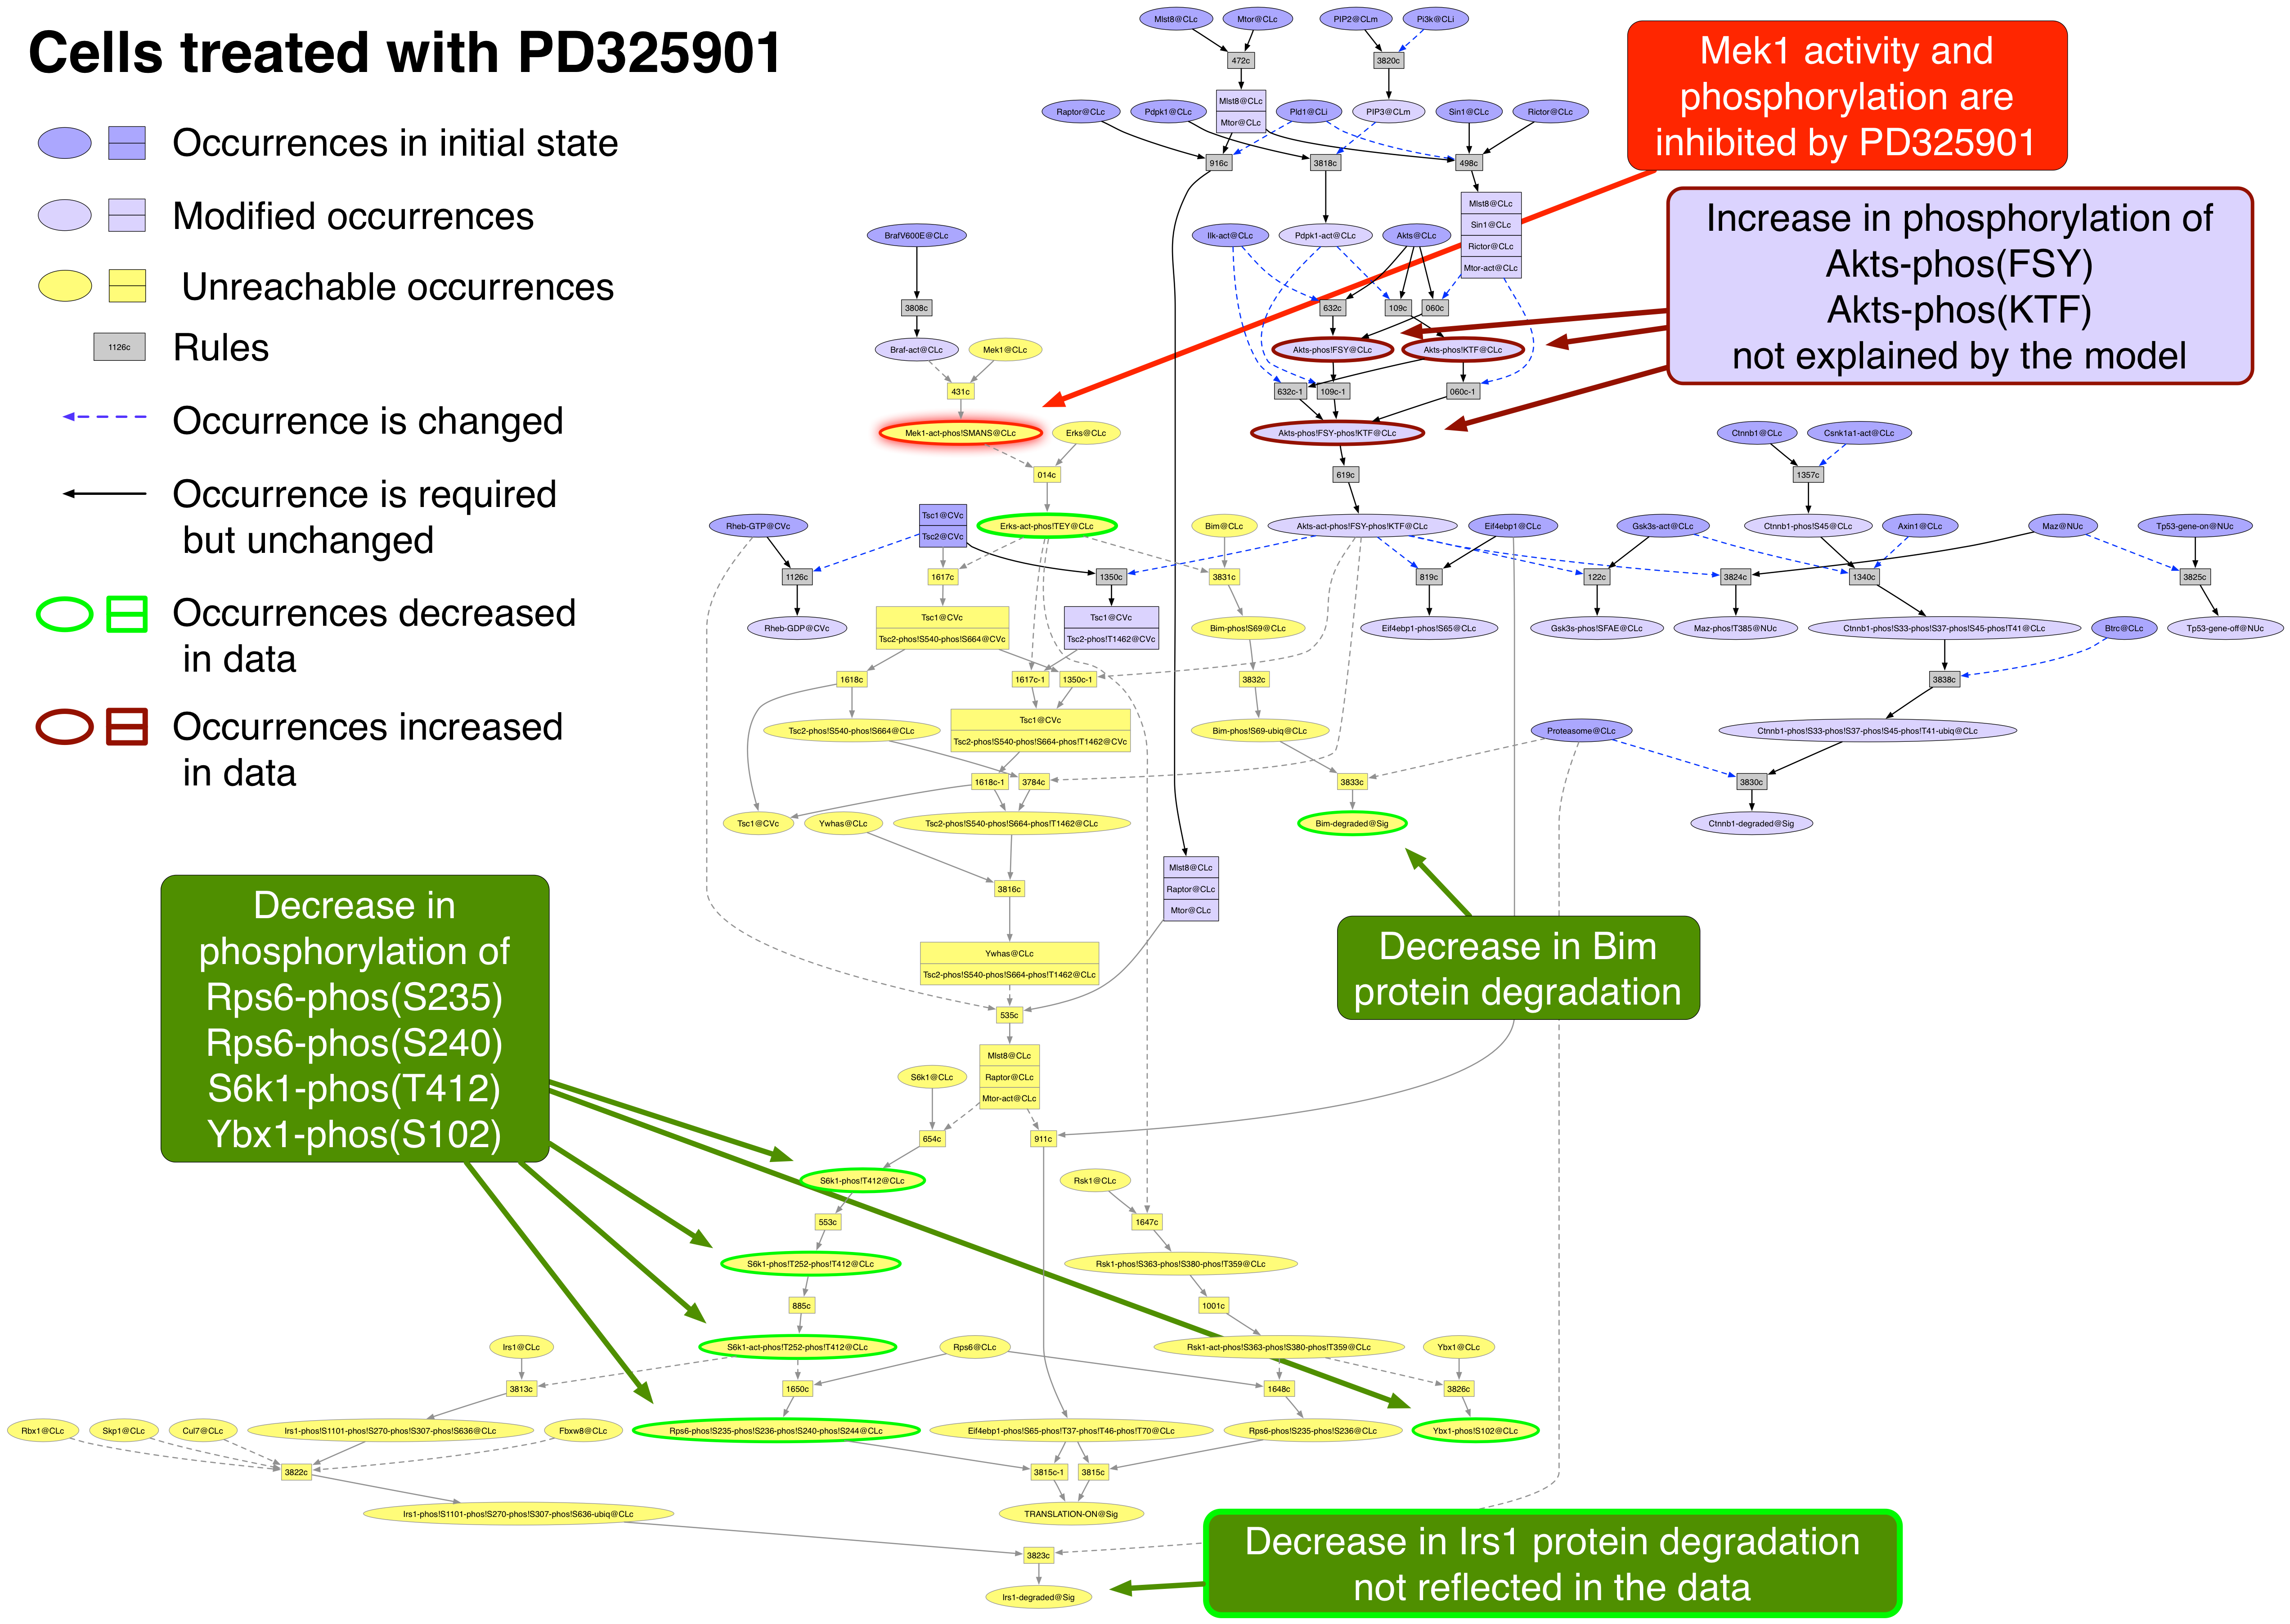
Exported image of PD325901 perturbation decorated in Graffle
PLX4720 PubChemCID 24180719
PLX4720 binds to the ATP binding site of active Braf and Raf1. It is 10 times more effective towards Braf(V600E) than wild-type Braf or Raf1. At the concentration used (120 nM) it should be more effective on Braf(V600E) than Raf1 [18287029].
Occurrence |
Change |
Explained? |
Ampkas-phos!LRtSC |
increased |
no |
Bim |
increased |
yes |
Cox2 |
decreased |
no |
Ctnnb1 |
increased |
no |
CyclinB1 |
decreased |
no |
CyclinD1 |
decreased |
no |
Mek1-phos!SMANS |
decreased |
yes |
Myc |
decreased |
no |
Rb1-phos!S608-phos!S807-phos!S811 |
decreased |
no |
Rps6-phos!S235 |
decreased |
yes |
S6k1-phos!T412 |
decreased |
yes |
Tp53 |
increased |
no |
Ybx1-phos!S102 |
decreased |
yes |
- Return to the unperturbed network by clicking on the "graph2:SKMEL133Dish" tab.
- Select the "Selections" tab in the lower right panel.
- Click on "Reset All Selections". The red node "Akts-act-phos!FSY-phos!KTF@CLc" will revert to blue to show that it is no longer avoided.
- Select the "Occurrences" tab in the lower right panel.
- Type "BrafV600E" in the Find Occurrence window.
- Press on the Tab key until "BrafV600E@CLc" is highlighted in the list below.
- Click on the Find button. This will locate and highlight the requested occurrence node in the main view window.
- Click on this node to open the context tab in the lower right panel.
- Click on the "Avoid occ" button in the context window. The node will turn red.
- Press the button labeled "Subnet" in the tool bar. Shortly a new tab will appear displaying a graph representing a subnet of the original graph with all of the occurrences that require "BrafV600E@CLc" removed.
- Press the button labeled "In Context". This makes a copy of the unperturbed network with the unreachable occurrences grayed out.
- The graph can be exported as an image (png, jpg, xdot, eps, or svg) using "Export/Export Image.." menu and decorated for presentations using standard markup applications such as PowerPoint or Graffle. An example is provided below.
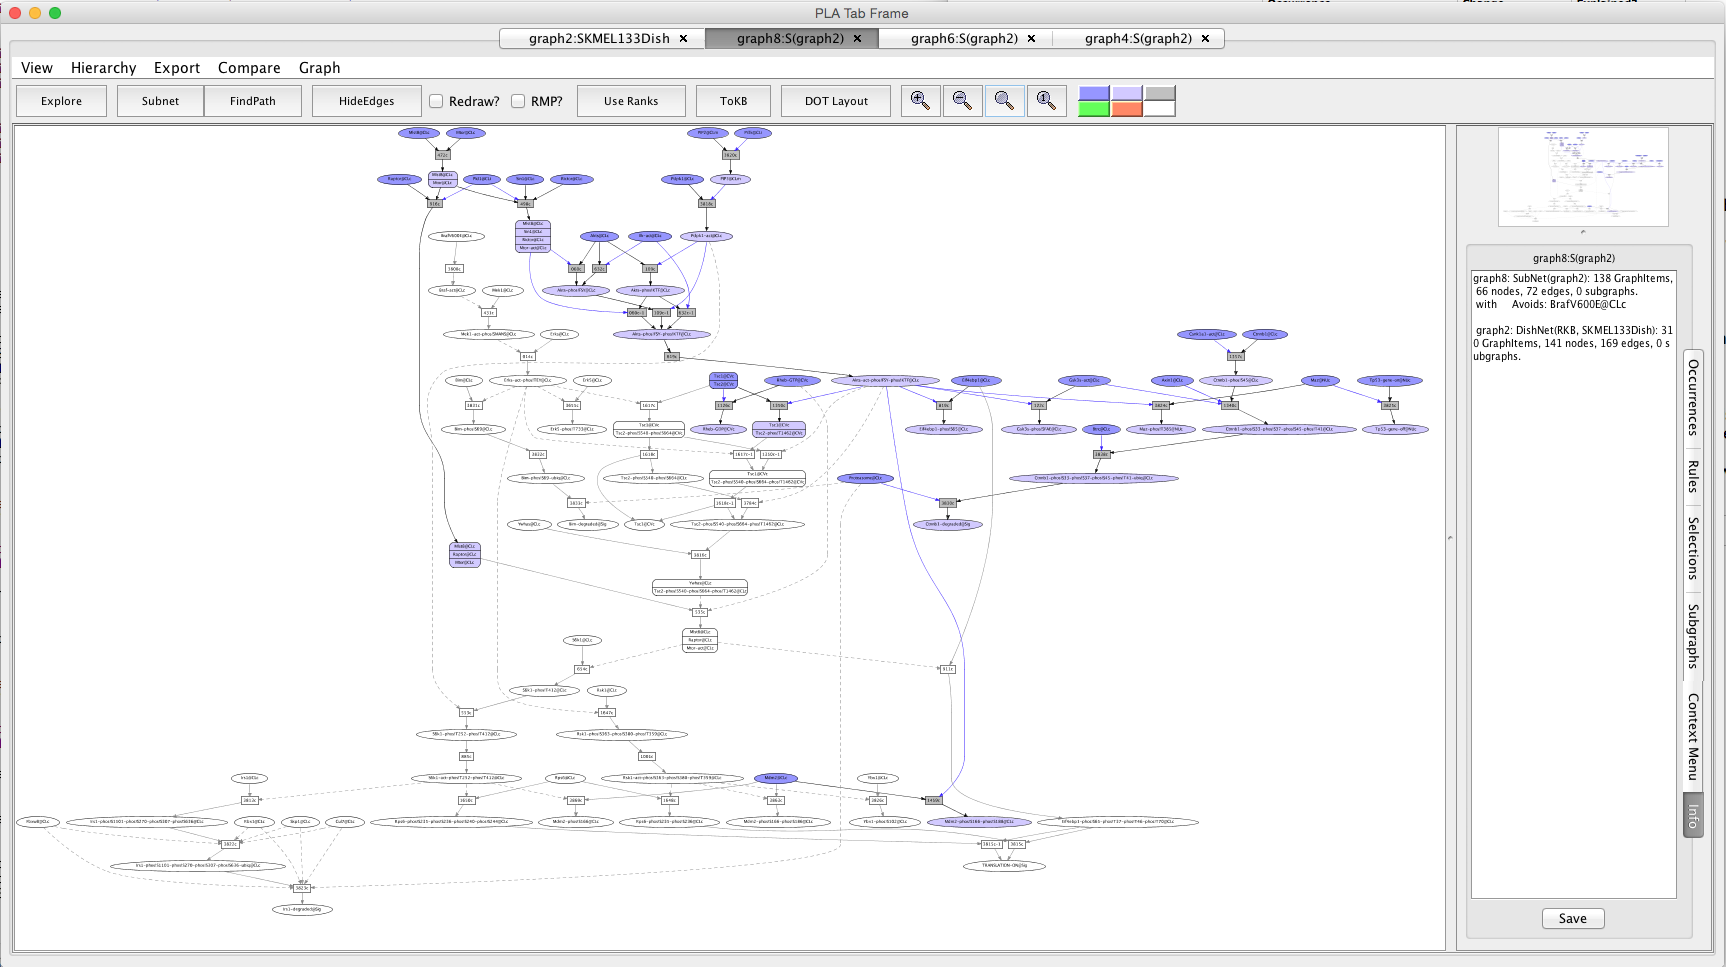
Screen shot of the network after perturbation with PLX4720
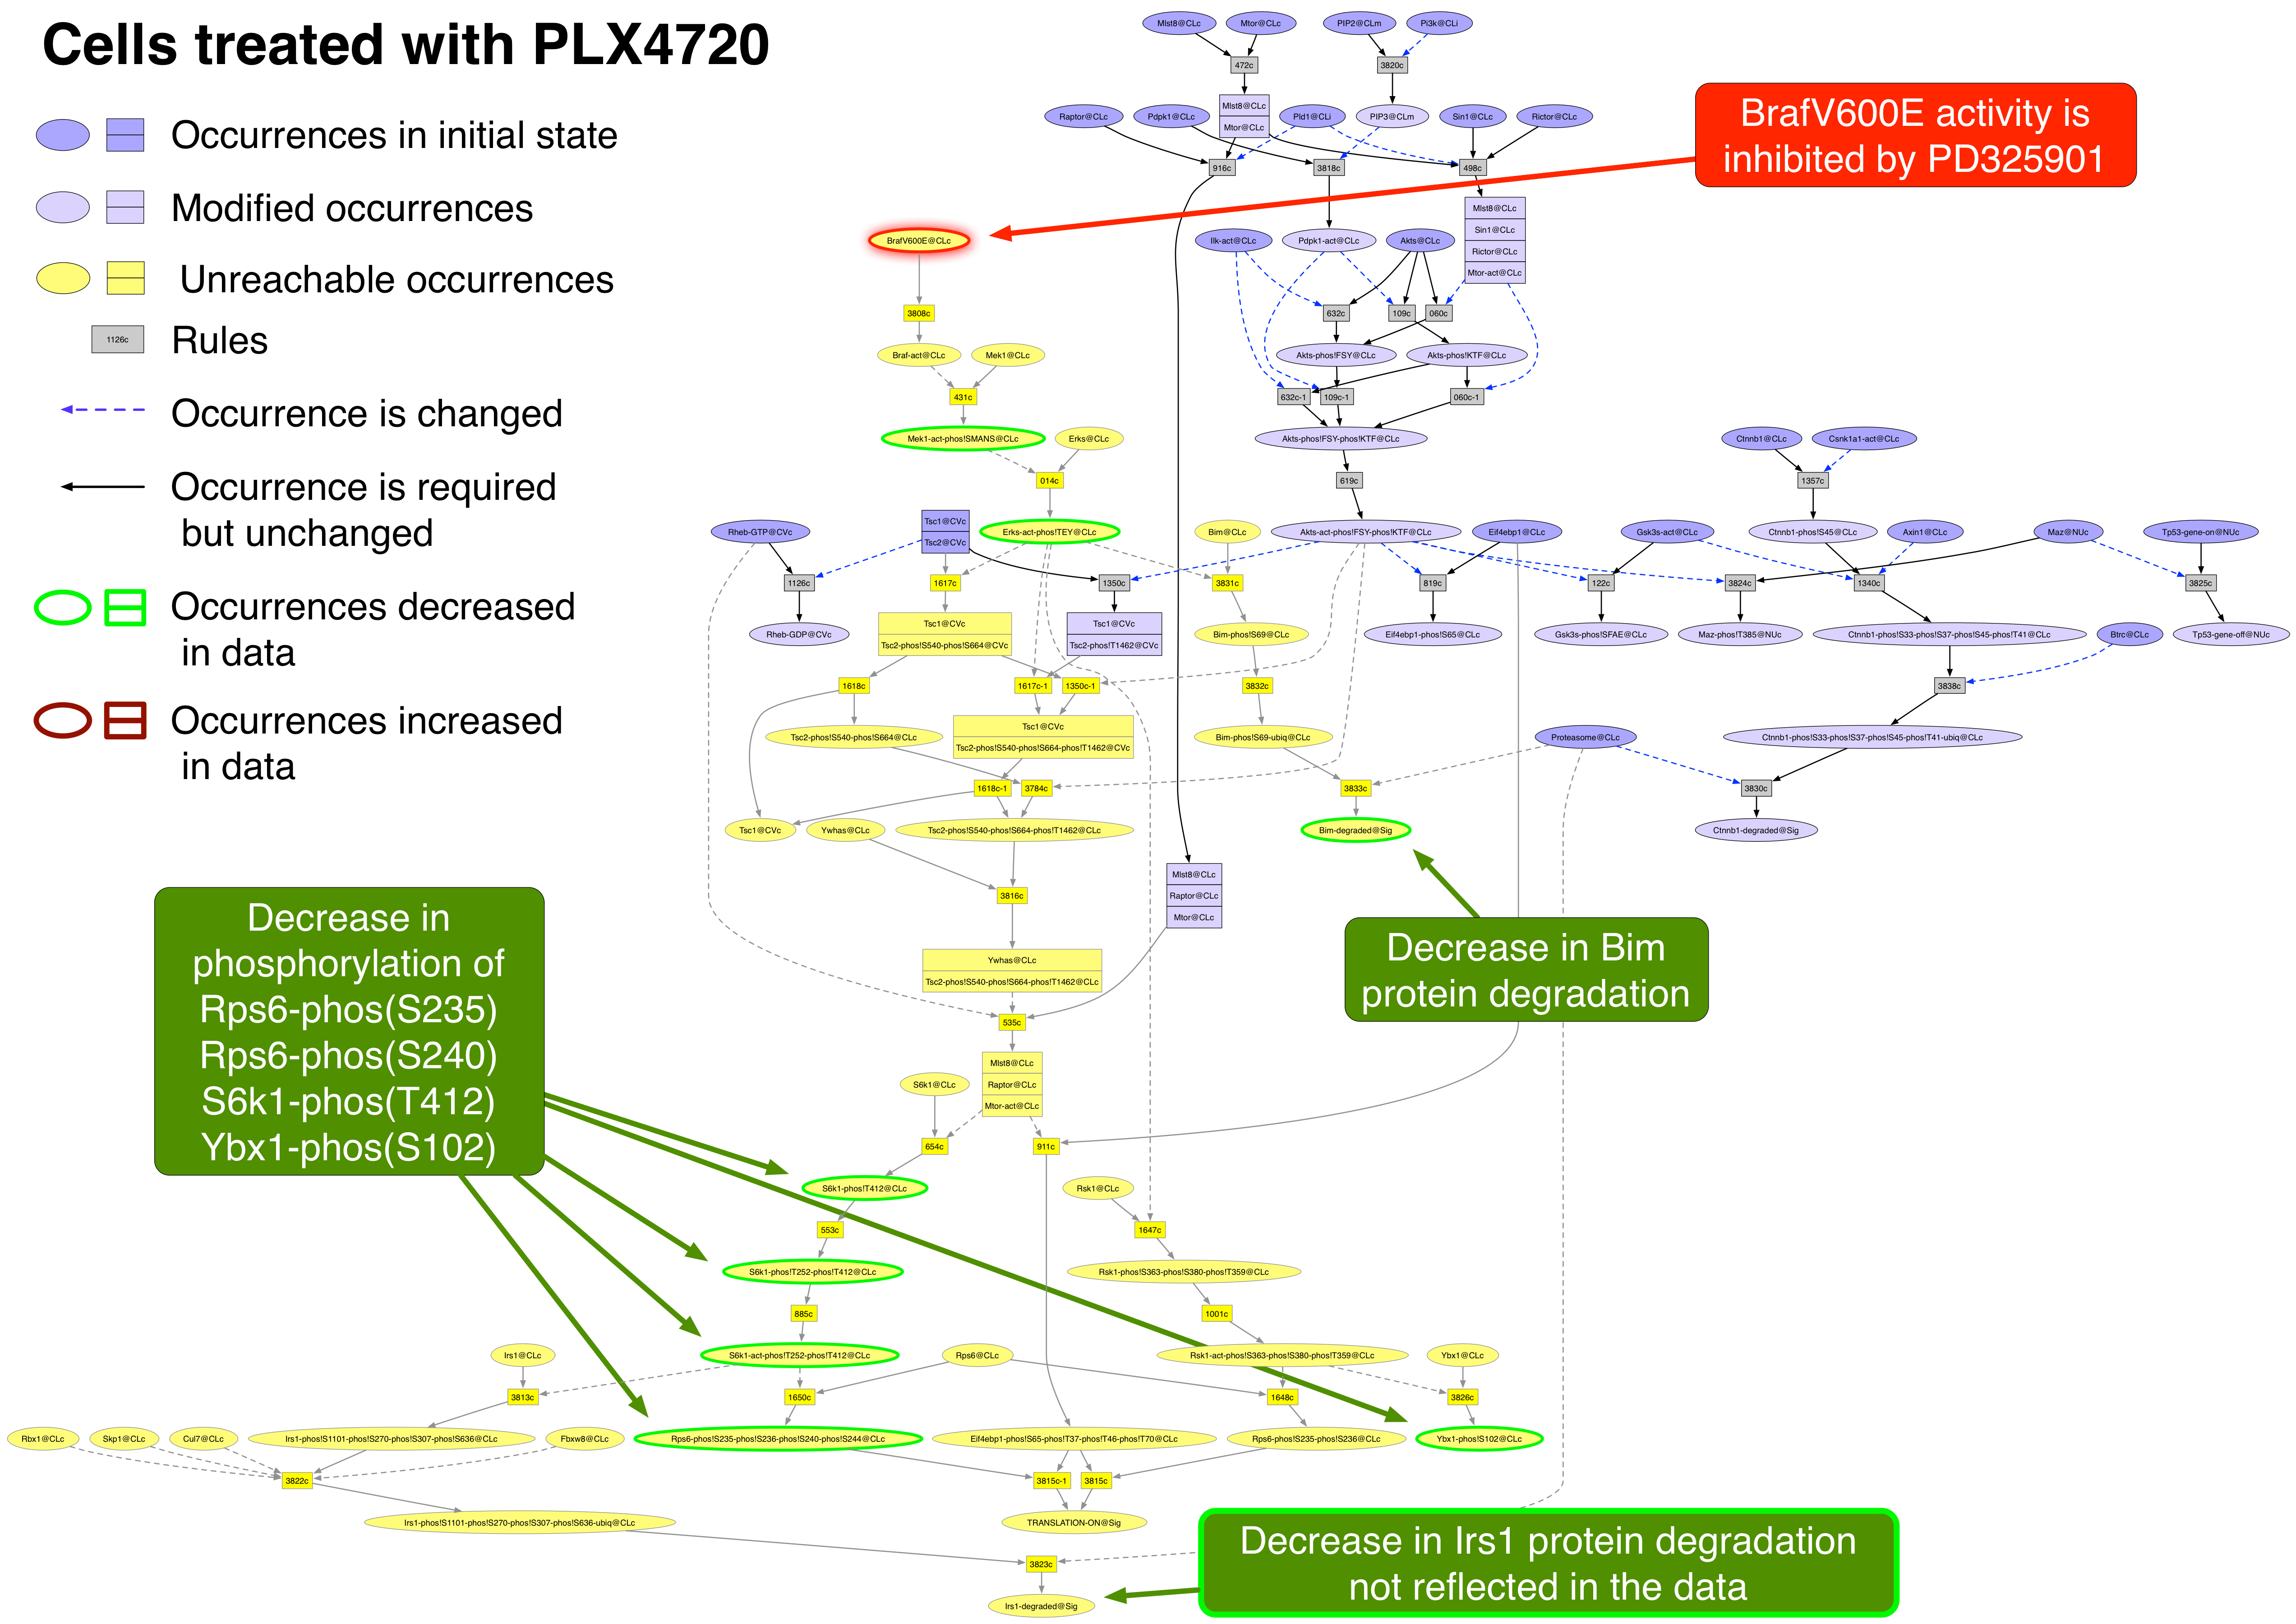
Exported image of PLX4720 perturbation decorated in Graffle
Temsirolimus PubChemCID 23724530
Temsirolimus inhibits Mtorc1 activity (a complex of Mtor, Mlst8, and Raptor) but enhances Mtorc2 activity (a complex of Mtor, Mlst8, Sin1, and Rictor) [24748656].
Occurrence |
Change |
Explained? |
Akts |
decreased |
no |
Akts-phos!FSY |
increased |
yes |
Akts-phos!KTF |
increased |
yes |
Ampkas-phos!LRtSC |
decreased |
no |
Cav1 |
increased |
no |
Col6a1 |
increased |
no |
Cox2 |
increased |
no |
CyclinB1 |
decreased |
no |
CyclinD1 |
increased |
no |
CyclinE1 |
increased |
no |
Eif4ebp1-phos!S65 |
decreased |
yes |
Eif4ebp1-phos!T37-phos!T46 |
decreased |
yes |
Fn1 |
increased |
no |
Irs1 |
increased |
yes |
Mek1-phos!SMANS |
decreased |
no |
Pai1 |
increased |
no |
Plk1 |
decreased |
no |
Rps6 |
decreased |
no |
Rps6-phos!S235 |
decreased |
yes |
Rps6-phos!S240 |
decreased |
yes |
S6k1-phos!T412 |
decreased |
yes |
Tp53 |
increased |
no |
Tsc2-phos!T1462 |
decreased |
yes |
- Return to the unperturbed network by clicking on the "graph2:SKMEL133Dish" tab.
- Select the "Selections" tab in the lower right panel.
- Click on "Reset All Selections".
- Select the "Occurrences" tab in the lower right panel.
- Type "Mtor" in the Find Occurrence window.
- Press on the Tab key until "Mlst8:Mtor-act:Raptor@CLc" is highlighted in the list below.
- Click on the Find button. This will locate and highlight the requested occurrence node in the main view window.
- Click on this node to open the context tab in the lower right panel.
- Click on the "Avoid occ" button in the context window. The node will turn red.
- Press the button labeled "Subnet" in the tool bar. Shortly a new tab will appear displaying a graph representing a subnet of the original graph with all of the occurrences that require "Mlst8:Mtor-act:Raptor@CLc" removed.
- Press the button labeled "In Context". This makes a copy of the unperturbed network with the unreachable occurrences grayed out.
- The graph can be exported as an image (png, jpg, xdot, eps, or svg) using "Export/Export Image.." menu and decorated for presentations using standard markup applications such as PowerPoint or Graffle. The example provided below is an example where there is a negative effect in part of the network (below Mtorc1) and a positive effect in another part (below Mtorc2).
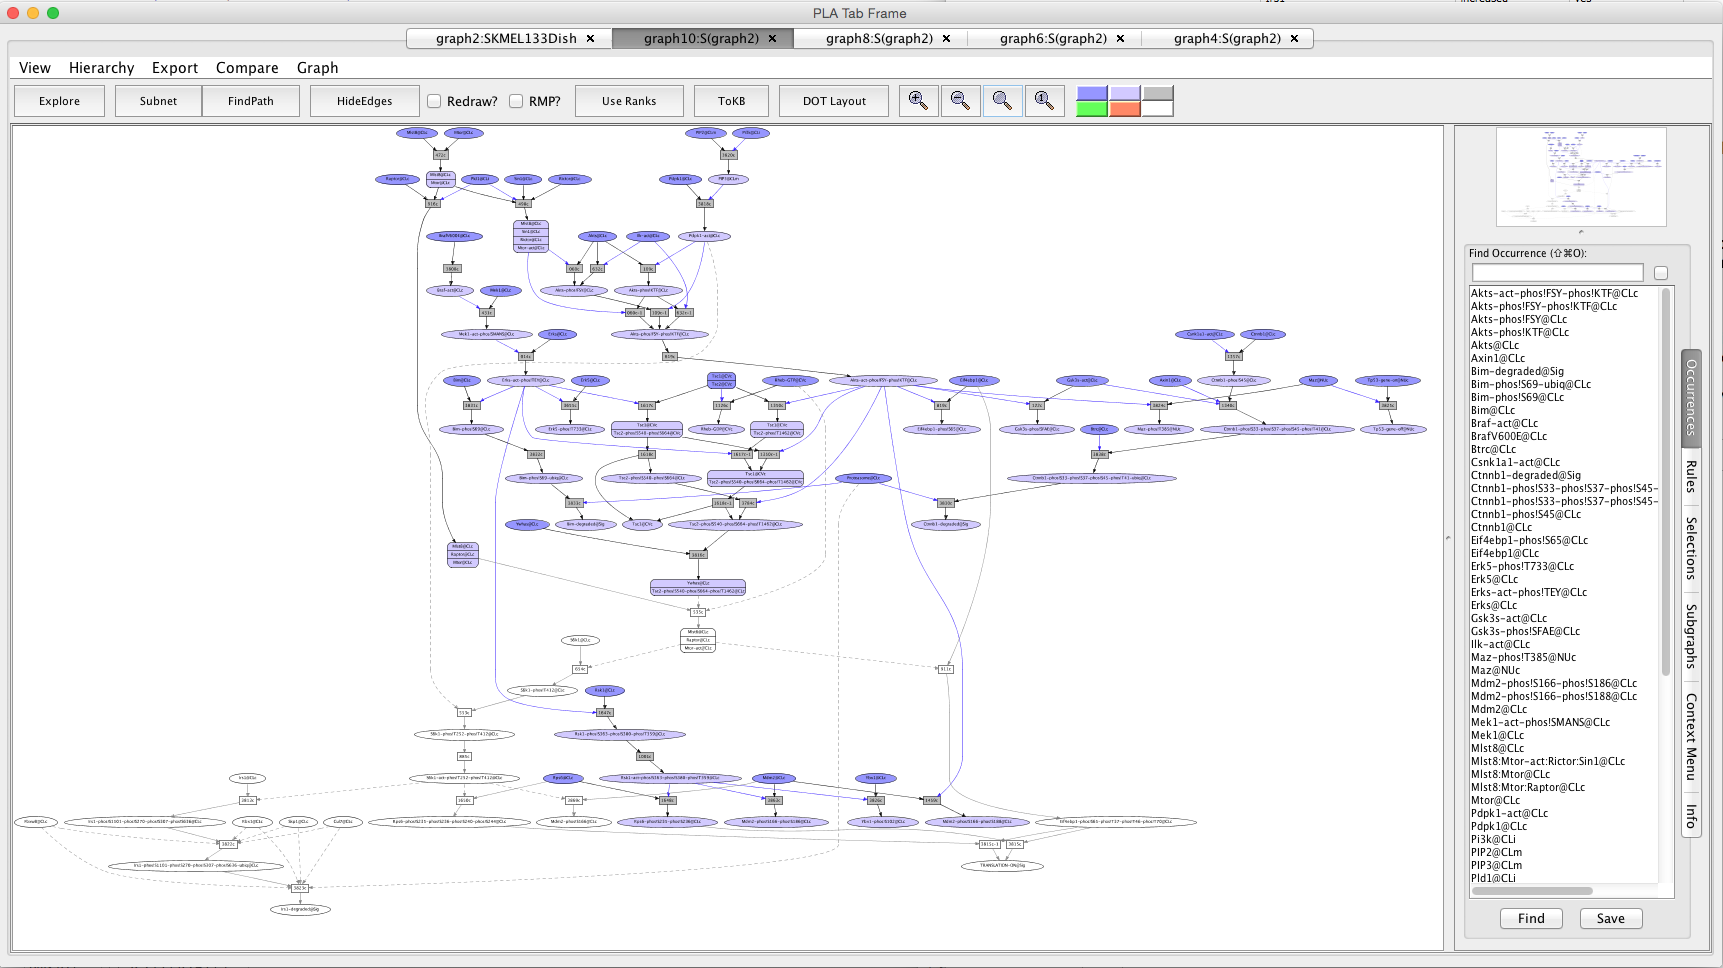
Screen shot of the network after perturbation with Temsirolimus
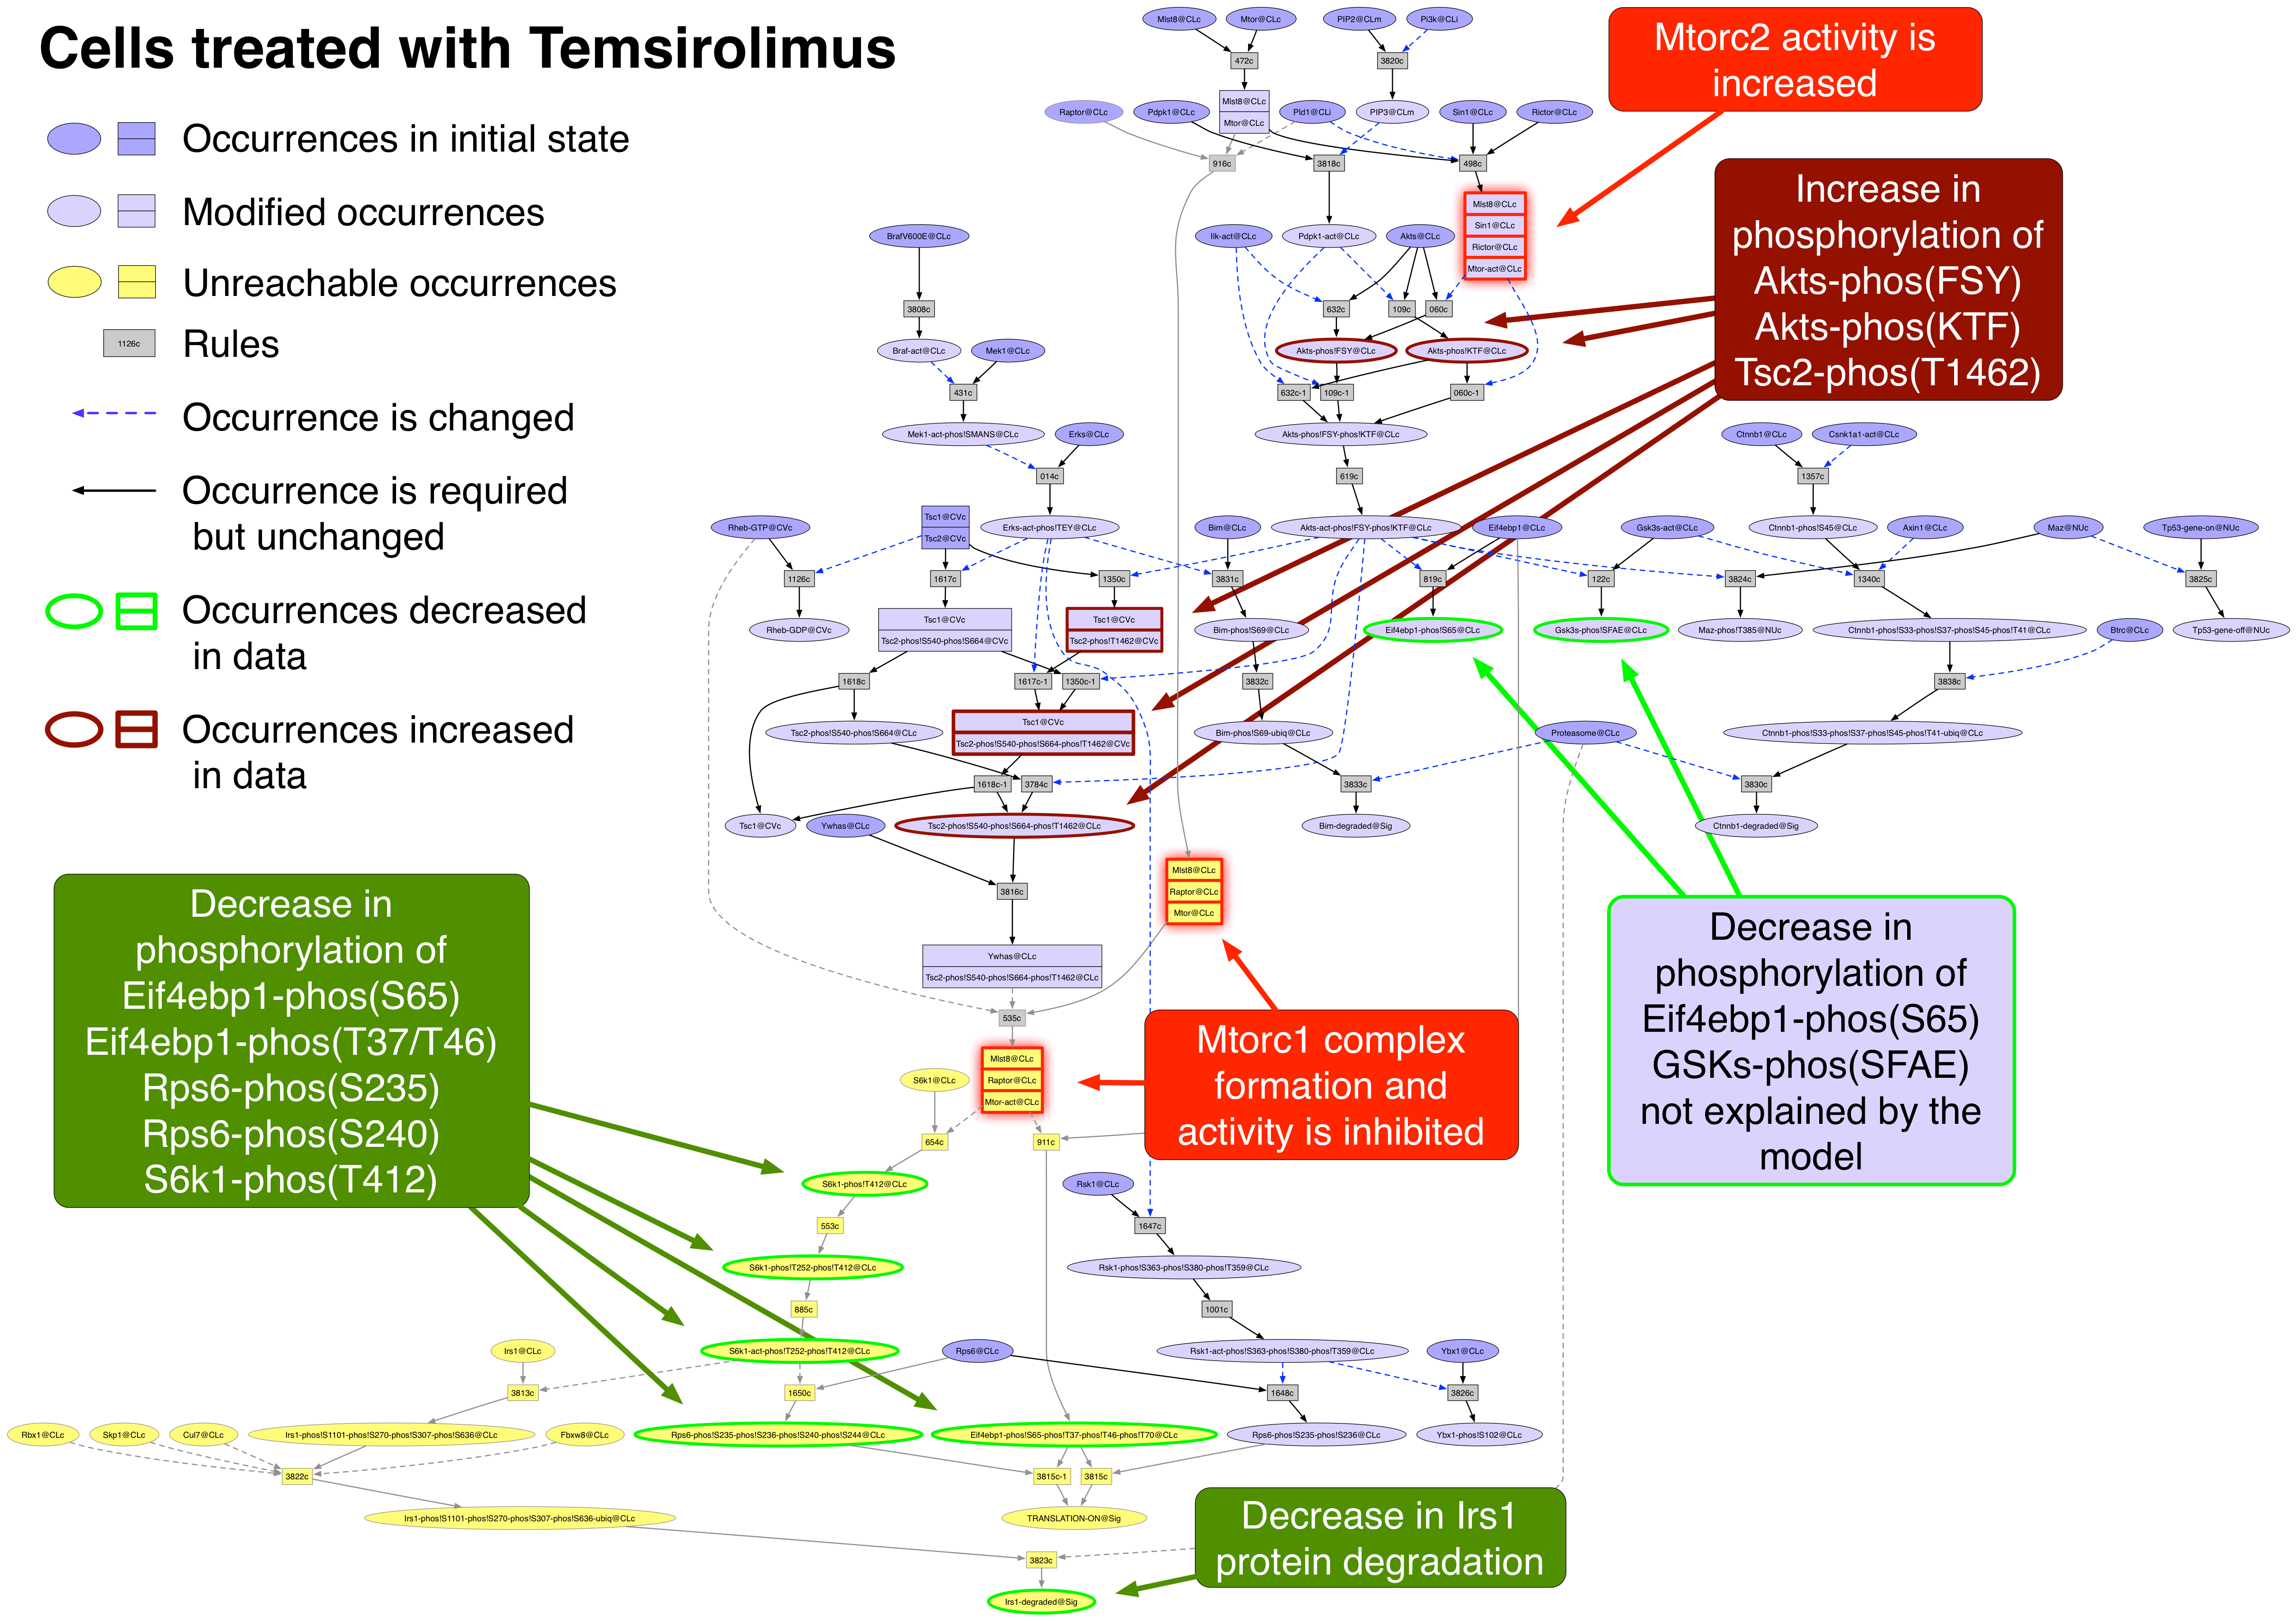
Exported image of Temsirolimus perturbation decorated in Graffle
ZSTK474 PubChemCID 11647372
ZSTK474 inhibits all four isoforms of the catalytic subunit of Pi3k [24748656].
Occurrence |
Change |
Explained? |
Acc1 |
decreased |
no |
Akts |
increased |
no |
Akts-phos!FSY |
decreased |
yes |
Akts-phos!KTF |
decreased |
yes |
Cav1 |
increased |
no |
Chek2-phos!T68 |
increased |
no |
Cox2 |
increased |
no |
CyclinB1 |
decreased |
no |
CyclinD1 |
increased |
no |
Eif4ebp1-phos!S65 |
decreased |
yes |
Eif4ebp1-phos!T37-phos!T46 |
decreased |
yes |
Fn1 |
increased |
no |
Gsk3s-phos!SFAE |
decreased |
yes |
Irs1 |
increased |
yes |
Pai1 |
increased |
no |
Plk1 |
decreased |
no |
Rps6 |
decreased |
no |
Rps6-phos!S235 |
decreased |
yes |
Rps6-phos!S240 |
decreased |
yes |
S6k1-phos!T412 |
decreased |
yes |
Tp53 |
increased |
no |
- Return to the unperturbed network by clicking on the "graph2:SKMEL133Dish" tab.
- Select the "Selections" tab in the lower right panel.
- Click on "Reset All Selections".
- Select the "Occurrences" tab in the lower right panel.
- Type "Pi3k" in the Find Occurrence window.
- Press on the Tab key until "Pi3k@CLi" is highlighted in the list below.
- Click on the Find button. This will locate and highlight the requested occurrence node in the main view window.
- Click on this node to open the context tab in the lower right panel.
- Click on the "Avoid occ" button in the context window. The node will turn red.
- Press the button labeled "Subnet" in the tool bar. Shortly a new tab will appear displaying a graph representing a subnet of the original graph with all of the occurrences that require "Pi3k@CLi" removed.
- Press the button labeled "In Context". This makes a copy of the unperturbed network with the unreachable occurrences grayed out.
- The graph can be exported as an image (png, jpg, xdot, eps, or svg) using "Export/Export Image.." menu and decorated for presentations using standard markup applications such as PowerPoint or Graffle. An example is provided below.
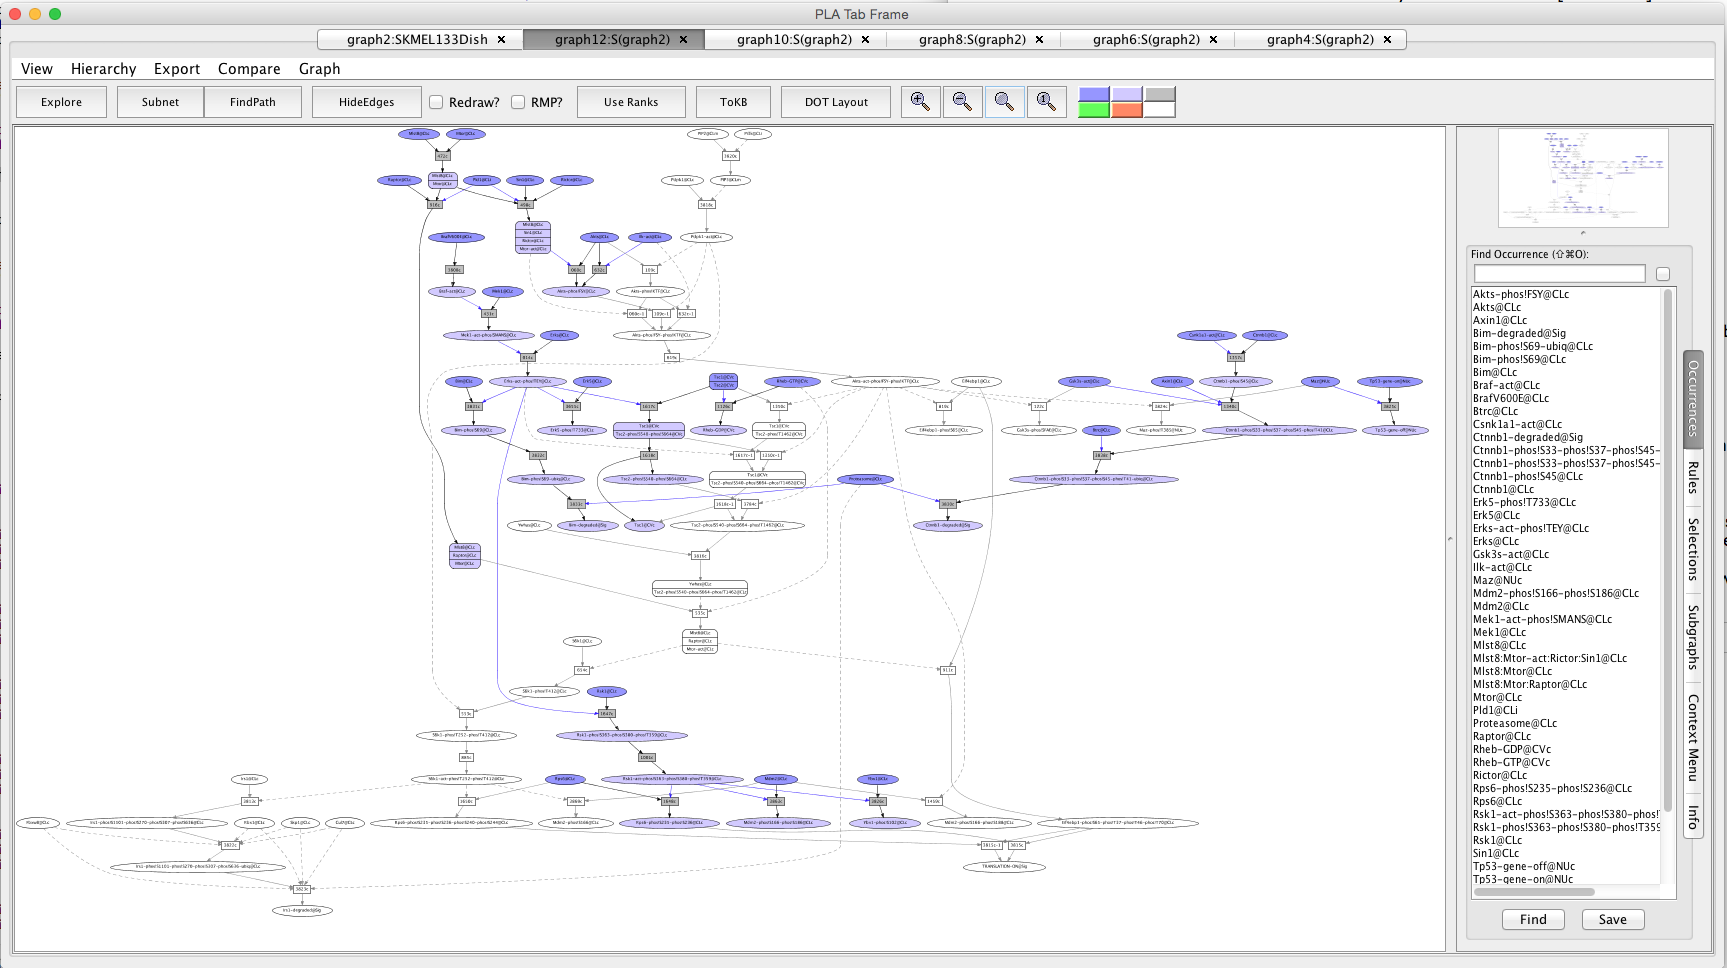
Screen shot of the network after perturbation with ZSTK474
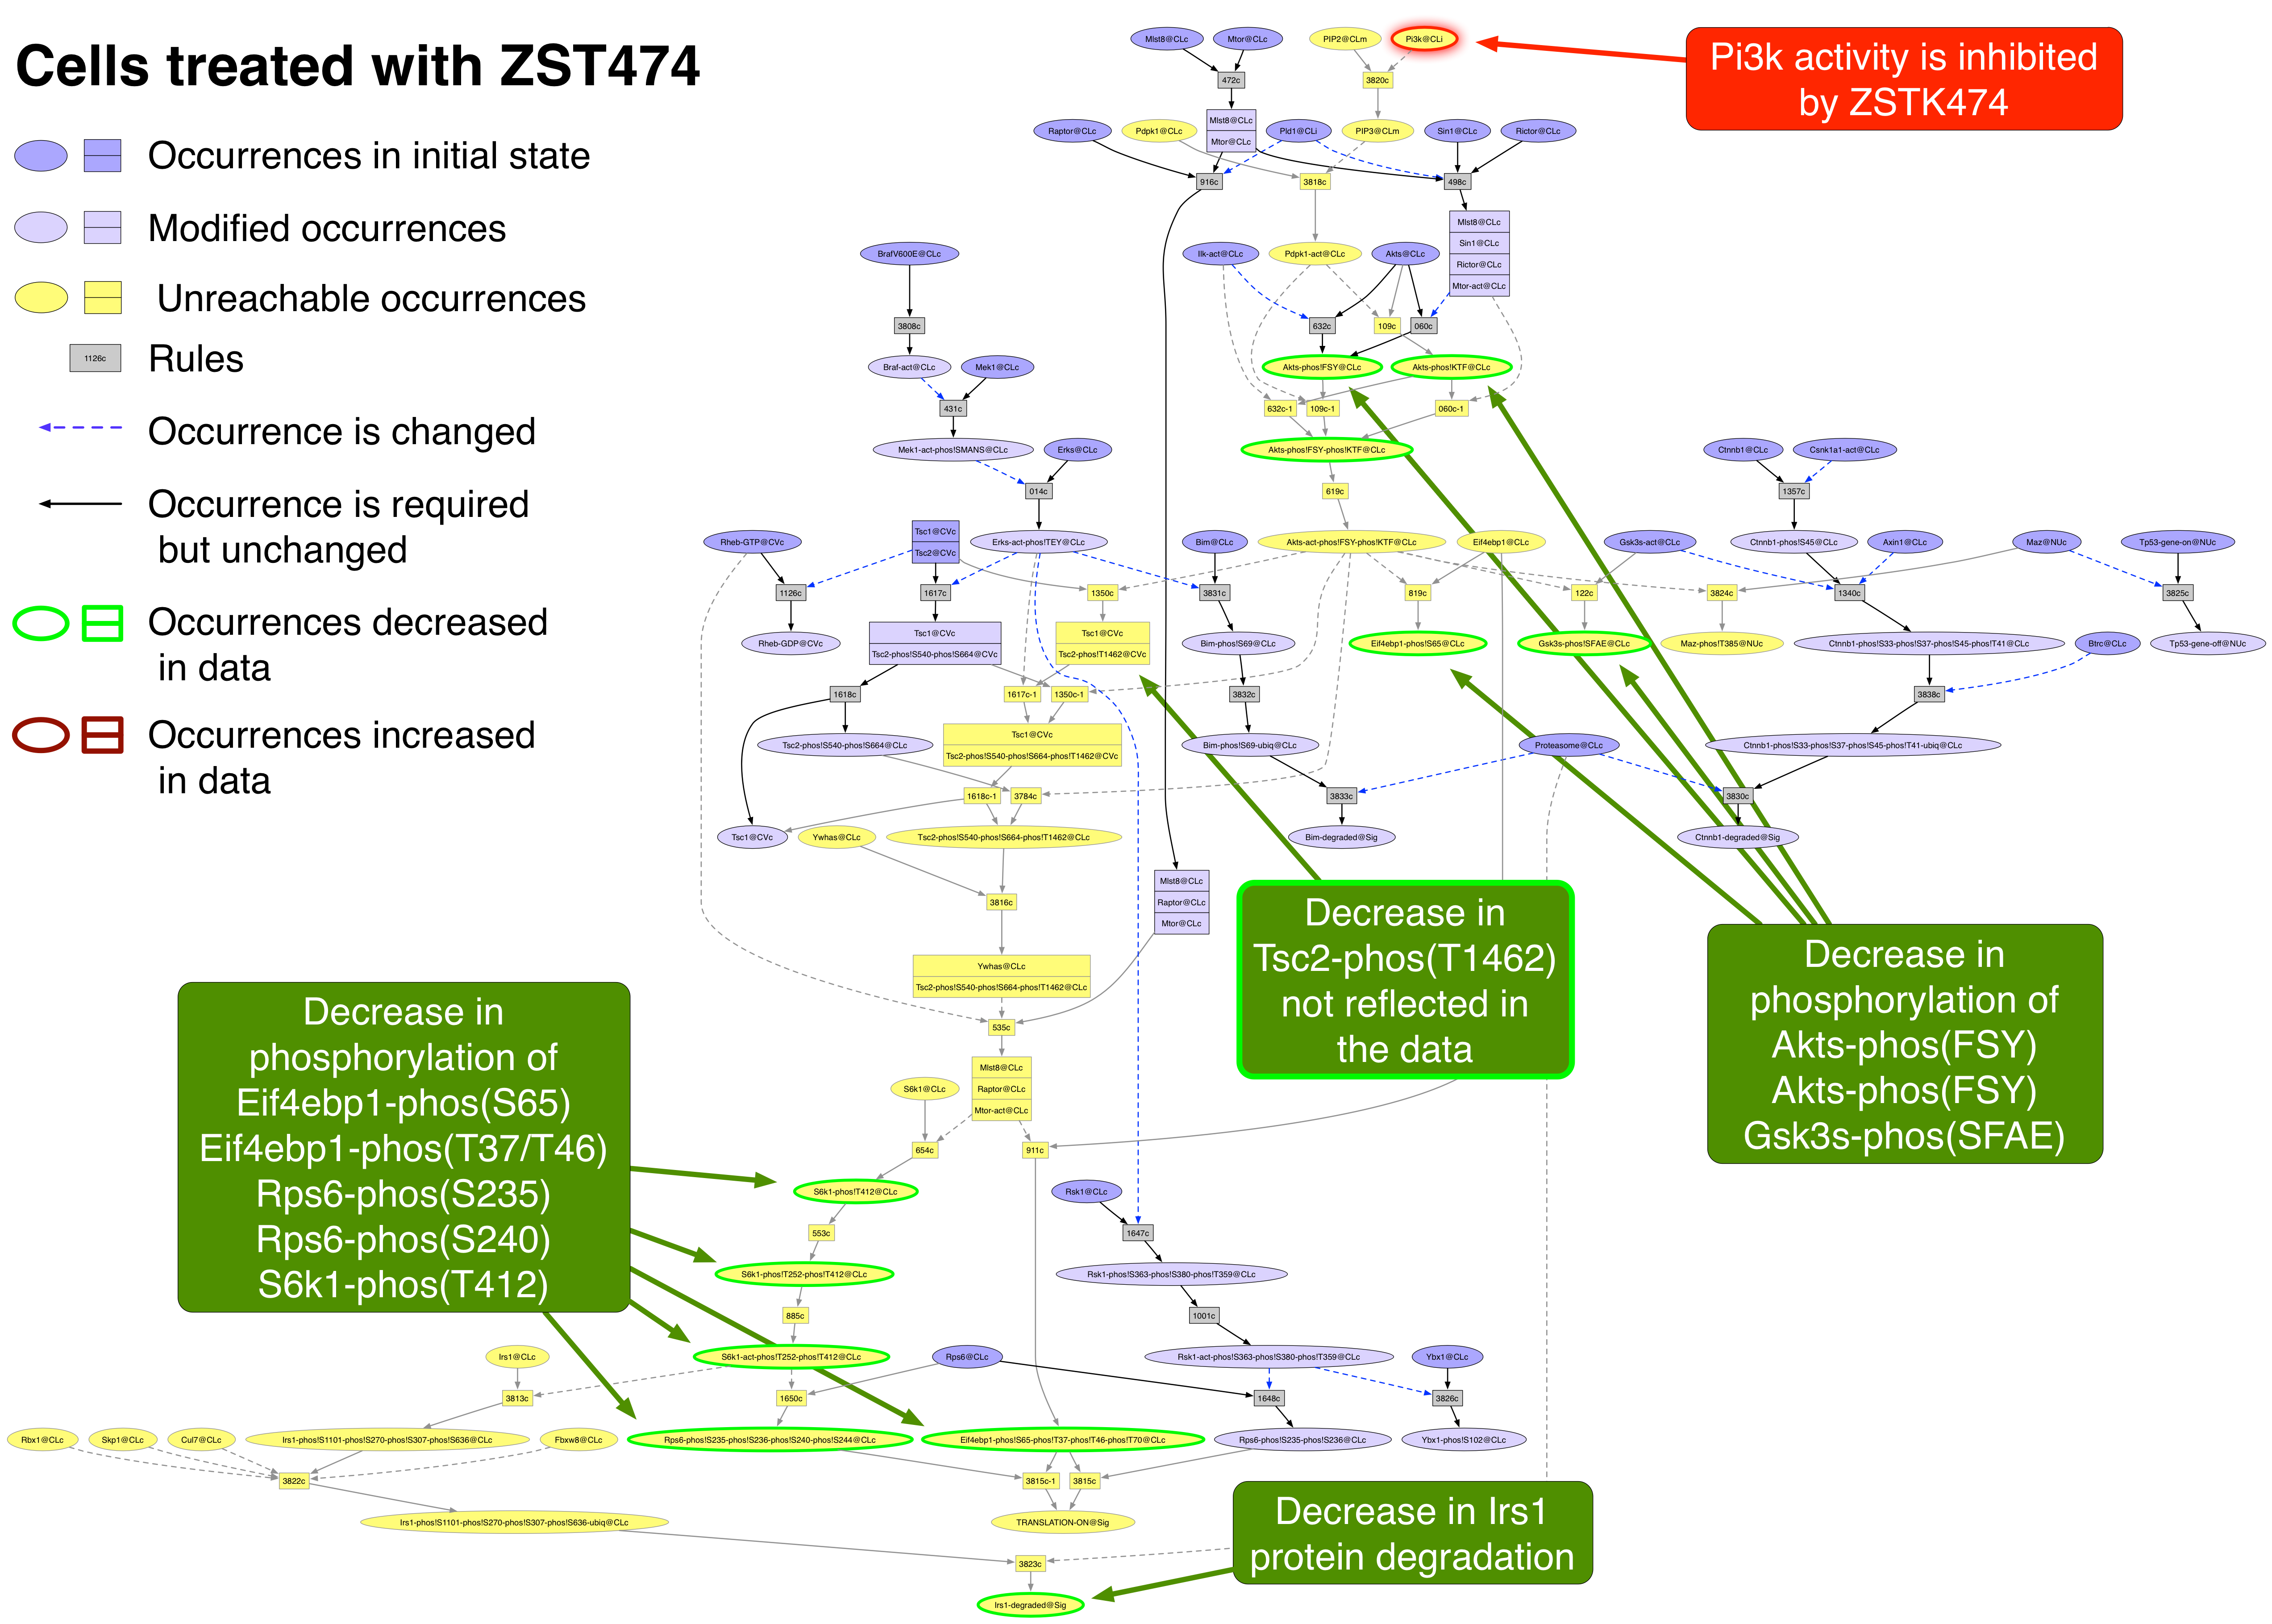
Exported image of ZSTK474 perturbation decorated in Graffle
Conclusion
This has been a demonstration of how we use the Pathway Logic STM model to use what we know about intracellular signal transduction to explain experimental results. The rules used in the model are derived from experimental results, so if the model were complete we should be able to use the network derived from exponentially growing cultured cells to trace the paths from a known perturbation to the measured effects. In some of the cases, we were successful. Our successes were predominantly in the phosphorylation cascades and protein degradation events used in growing cells. We were less effective in explaining the decreases in expression of proteins due to inhibition of translation or transduction, or changes in the cell cycle. There is still a lot of experimental evidence in the literature to collect and make into rules. There are still a lot of experiments that need to be performed and published. One caveat -- not all of the unexplained results are due to an incomplete model. Only one experiment was performed so the probabilty that the results could be reproduced cannot be measured. Although 3 biological replicates were used - no information about the variance were provided. In addition, we obtained the mechanism of action of the drugs from a small sampling of the literature. Any of the drugs could have additional effects that we did not find.
Learning about how a cell works is still a work in progress. The Pathway Logic STM model is a tool designed to help. Hopefully it does.
References
- 26284497: Korkut A, Wang W, Demir E, Aksoy BA, Jing X, Molinelli EJ, Babur O, Bemis DL, Onur Sumer S, Solit DB, Pratilas CA, Sander C. Perturbation biology nominates upstream-downstream drug combinations in RAF inhibitor resistant melanoma cells. Elife. 2015 Aug 18;4.
- 25435214: Samatar AA, Poulikakos PI. Targeting RAS-ERK signalling in cancer: promises and challenges. Nat Rev Drug Discov. 2014 Dec;13(12):928-42. doi: 10.1038/nrd4281. Review. PubMed PMID: 25435214.
- 24748656: Dienstmann R, Rodon J, Serra V, Tabernero J. Picking the point of inhibition: a comparative review of PI3K/AKT/mTOR pathway inhibitors. Mol Cancer Ther. 2014 May;13(5):1021-31. doi: 10.1158/1535-7163.MCT-13-0639. Review. PubMed PMID: 24748656.
- 18287029: Tsai J, Lee JT, Wang W, Zhang J, Cho H, Mamo S, Bremer R, Gillette S, Kong J, Haass NK, Sproesser K, Li L, Smalley KS, Fong D, Zhu YL, Marimuthu A, Nguyen H, Lam B, Liu J, Cheung I, Rice J, Suzuki Y, Luu C, Settachatgul C, Shellooe R, Cantwell J, Kim SH, Schlessinger J, Zhang KY, West BL, Powell B, Habets G, Zhang C, Ibrahim PN, Hirth P, Artis DR, Herlyn M, Bollag G. Discovery of a selective inhibitor of oncogenic B-Raf kinase with potent antimelanoma activity. Proc Natl Acad Sci U S A. 2008 Feb 26;105(8):3041-6. doi: 10.1073/pnas.0711741105. PubMed PMID: 18287029; PubMed Central PMCID: PMC2268581.
- 17563061: Logie L, Ruiz-Alcaraz AJ, Keane M, Woods YL, Bain J, Marquez R, Alessi DR, Sutherland C. Characterization of a protein kinase B inhibitor in vitro and in insulin-treated liver cells. Diabetes. 2007 Sep;56(9):2218-27. PubMed PMID: 17563061.