Guided Tour of the Pathway Logic Model of Protease-network
The Pathway Logic (PL) model of Proteases represents the interaction networks of proteases in Gram-positive bacteria. A brief introduction and biological background for the protease model can be found here . To be self-contained, this guide provides a little introduction to the use of PLA. More details can be found in the SmallKB guide and the PLA reference manual.
Signal transduction pathways/processes are represented as collections of transition rules that change the state and/or location of signaling proteins. A protein together with its state and location is called an occurrence and the transition rules, representing the biochemical reactions/transformations, are curated from the literature and collected into a knowledge base (KB).
In this guided tour, double click on a figure to see an enlarged version. Single click to restore the figure to its original size.
Table of Contents
- PLA overview of the model
- Getting information about graph nodes
- Analysis of Protease-network model
- Finding Pathways or subnets
- Comparative analysis and target inhibition
- Involvement of FtsH and ClpCP proteases in LonB protease expression
- Involvement of FtsH in the expression Bpr, Epr, Mpr, NprB, NprE, Vpr and WprA
- Predicting regulatory roles for FtsH and ClpCP in toxin production
- A possible role for CtsR in the inhibition of B. subtilis sporulation
PLA overview of the model
PLA provides a graphical representation of the Protease-network and the ability to browse and analyze this network. Using PLA one can:
- display the network of signaling reactions for a specified model;
- formulate and submit queries to find subnets in pathways, for example, activating one protein without activating a second protein, or exhibiting a phenotype signature such as sporulation;
- compare subnets and/or pathways - what is shared, what is different;
- explore a network of rules to discover what is up/down stream of some component or rule and to see if they can be connected.
- Find knockouts - proteins whose omission prevents reaching a specified state.
Startup
If you haven't already started the Protease online demo, you can do so by clicking here and following the instructions.
When PLA starts up, a knowledge base manager window (title: PLA KBManager) appears in the upper left corner of your screen. The KBManager displays the name of the Protease knowledge base (rule sets) that is highlighted in blue.
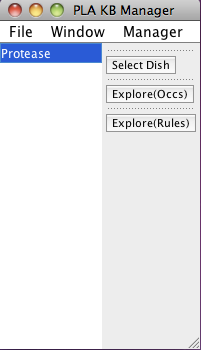
Screen shot of the PLA KBManager
Start by selecting a predefined dish: press the "Select Dish" button on the right side of the KBManager window. This produces a menu with two options: "Edit" and "PreDefined". Select (click on) "PreDefined". This produces a (sub)menu with a pre-defined dish "Protease-network". Select "Protease-network" (by clicking on the corresponding menu item). Shortly a PLA viewer window (titled InitialNet for Protease-network (graph2)) will appear on your screen displaying the Protease-network model (the network of reactions reachable starting from the occurrences in Protease-network). [Note that the graph number you see when carrying out the steps of the guided tour may differ from those shown here, if for example you create extra graphs to try out an idea, or the developer of the guide made intermediate graphs or restarted the system at some point. What is important is the series of choices made to generate the graph.]
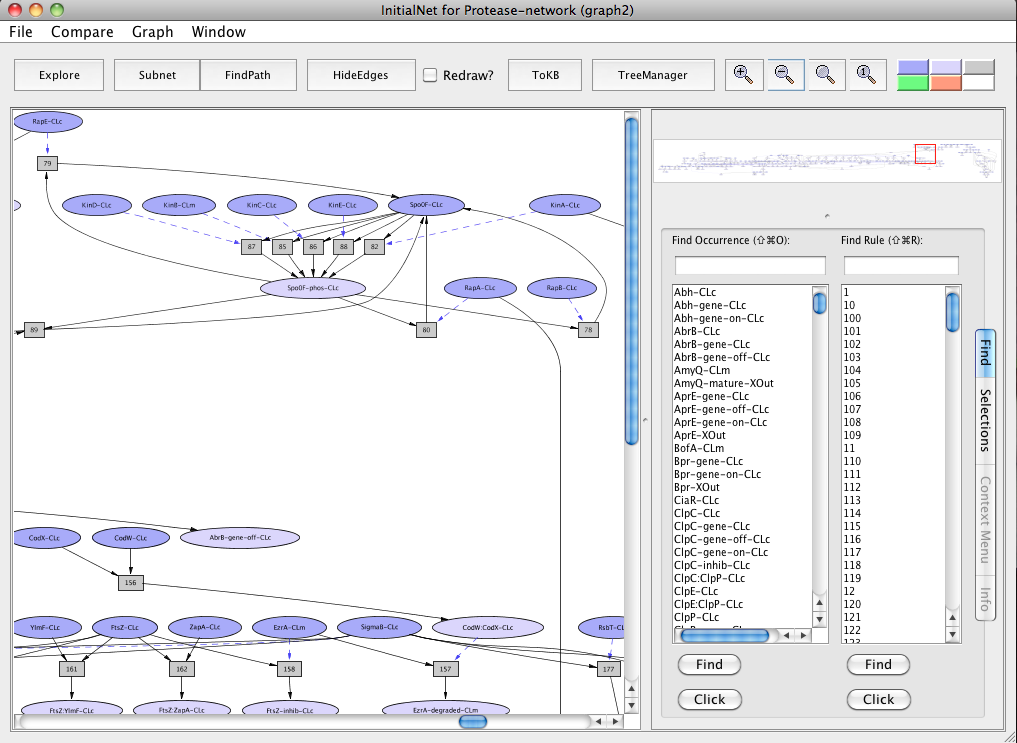
Screen shot of the Protease-network graph
A network of reactions is displayed as a graph with two kinds of node. Ovals represent occurrences ---proteins or chemicals in a specific state and location. For example the oval labeled Spo0F-phos-CLc represents Spo0F, phosphorylated (-phos) and located in the cytosol (-CLc).
Darker colored ovals represent occurrences in the initial state. Lighter colored ovals represent possible reachable states. Rectangles represent rules or transitions. The label in a rectangle is its (abbreviated) identifier in the knowledge base. Solid lines represents the consumed or produced depending on the direction of the arrow, doted lines represents the enzymatic relation.
Abbreviations
We use the following abbreviations.| Locations | ||
| XOut | ... | outside of the bacterial cell |
| CLm | ... | in/across the cell membrane |
| CLw | ... | cell wall |
| CLc | ... | cytosol |
| Sig | ... | represents phenotype; for example - sporulation |
| Protein Modifications | ||
| phos | ... | phosphorylated |
| act | ... | activated |
| inhib | ... | inhibited |
| bound | ... | bound |
| mature | ... | matured |
| degraded | ... | degraded |
| anchored | ... | anchored |
| cleaved | ... | cleaved |
| Gene Modifications | ||
| on | ... | up-regulation of gene |
| off | ... | down-regulation of gene |
Navigating the Protease-Network Graph
In the upper right of the PLA graph window is a thumbnail sketch of the full graph with a red rectangle delineating the part of the graph visible in the graph panel (on the left). Drag the rectangle around or click on different points in the thumbnail to change what is visible in the graph panel.
In the lower right of the PLA graph window is an information pane with several tabs. The "Find" tab (the default) contains two lists: on the left a list of all occurrence nodes in the graph, and on the right a list of all rule nodes. You can use these lists to find a node of interest and center the view on that node.
For example, type "ra" in the text box above the occurrence list (under "Find Occurrence"). Tab completes "ra" to "RapA-CLc", the first occurrence in the list whose label contains "ra" as a prefix (ignoring case). Tab again to find the next match, "RapA-gene-CLc". (Continued tabbing cycles through the matches.) Note that the matched label is highlighted in the occurrence list. Double click on the highlighted occurrence (or click the "Find" button at the bottom) to center the visible part of the graph on the occurrence of interest. You can also use the scroll bar on the right of the occurrence list to find the occurrence of interest and select it by clicking directly on the item in the list. Finding rules works in a similar manner.
Some of the arrows lead to nodes not visible in the current view. To find out what is at the other end, click on the arrow. The information window (context tab) tells you what is the node at the other end. To go to the other end, either click on one of the buttons in the context window or double-click on the arrow.
Getting information about graph nodes
Clicking on a node displays information options in the Context tab of the information pane.- Click on the oval labeled RapA-CLc. The information panel (on the right) presents options for finding out about this occurrence. The button labeled
Show info displays information for debugging.
- Click on the button labeled About Occurrence. Now the panel displays information about RapA: its UniProt name, EC number, link to the UniProt web page and some synonyms.
- Click on the UniProt link. A browser window with the requested page will appear. (You can close the browser window when you are done looking at the page, or keep it around. Its independent of PLA.)
- Click on rule 80 (the rectangle labeled "80"). The information panel presents options for finding
out about rule 80. The button labeled Show info displays information for debugging; the button labeled Show Maude Rule displays the rewrite rule corresponding to the biochemical reaction in Maude syntax.
- Click on the button labeled Show Evidence. You will find a pubmed link to the paper used in curating rule 80.
Analysis of Protease-network model
In the following sections, we show how our results were derived from our analysis of protease-network. This includes finding pathways, comparing them, in silico knockout studies and model-based predictions. Specifically, we have examined the ClpP protease and Sortase A (SrtA) as critical components of the network. We also examine the roles of FtsH and ClpCP proteases and CtsR repressor protein in B. subtilis-based sporulation network.
Finding Pathways or subnets
A pathway or a subnet is a collection of rules assembled in response to a query. A query specifies goals --- occurrences that should be present, i.e. states and locations of proteins. It may also specify occurrences or rules to be avoided. The execution of a pathway leads from the model's initial state to a state satisfying the goals, while not passing through any states containing occurrences to be avoided, or using any rules to be avoided.
Comparative analysis and target inhibition
Back to contentsWe first generate two pathways that are of importance to us and find components that participate in both these pathways. Then, we test the importance of these common components by inhibiting it in a larger network identifying them as critical components or as choke points.
ClpP protease as Critical Component in Pathways
We identify ClpP as a key interacting component by comparing two pathways -- regulated intramembrane proteolysis (RIP) and the secretory precursor processing system.
Generation of RIP pathway: For this, find a subnet activating SigmaW (RIP involves the activation of SigmaW by the proteolytic cleavage of the anti-sigma factor RsiW).
- Make SigmaW-act-CLc visible in the graph by using the "Find" tab.
- Click on the occurrence SigmaW-act-CLc.
- Click on the Set goals button in the information panel. The node will turn green.
- Press the button labeled Subnet in the tool bar. Shortly a new window will appear displaying a graph "Subnet of Protease-network (graph 4)" representing a subnet leading to activation of SigmaW.
- You will see a new button in the tool bar labeled In Context. Press this button and you will see the subnet in the context of the original graph (context nodes not in the subnet are white). The button is now labeled DOT layout. Press again to get back to the original rendering.
Generation of the secretory precursor processing system: Next, find a subnet downregulating sipS and sipT genes (the secretory precursor processing system involves the transcriptional regulation of type I signal peptidases (SPases) sipT and sipS genes)
- Use the window menu to get back to the Protease-network window. Click on the menu labeled Window. At the bottom you will see the windows created so far organized in a hierarchy. For example the window titled "InitialNet for Protease-network (graph 2)" is the parent of the window titled "Subnet of Protease-network (graph 4)", and the KBManager window is the top level of the hierarchy. Select "InitialNet for Protease-network (graph 2)" and this window comes to the front.
- Reset the goal selection: either click the Set goals button for SigmaW-act-CLc if it is still visible, or select the "Selections tab" (on the right of the information panel) and click the button labeled Reset All Selections at the bottom.
- Now make SipS-gene-off-CLc and SipT-gene-off-CLc as goals. You can do this in the same way that you did for SigmaW-act-CLc, or in the Selections tab with the Set Goals option, click on All to display the list of occurrences. Find SipS-gene-off-CLc and SipT-gene-off-CLc in the list and check its box.
- Press Subnet in the tool bar.
Note that whenever you find and analyze pathways or subnets in the "InitialNet for Protease-network (graph 2)" make sure to reset the goal selection: either click the Set goals/ avoids button for highlighted proteins if it is still visible, or select the "Selections tab" (on the right of the information panel) and click the button labeled Reset All Selections at the bottom. This will prevent unwanted pathways or subnets from showing up in your desired pathway/ subnet analysis. Also, if you don't remember the selections used to obtain the current subnet, use the Graph menu and select "Show goals and avoids". A list will appear in the information pane.
Comparing Pathways
Now we can compare the regulated intramembrane proteolysis (RIP) and the secretory precursor processing system. In the new pathway window (Subnet of Protease-network (graph 6)) click on the menu labeled Compare. The window hierarchy will be displayed (gray names are not comparable graphs). Choose Subnet of Protease-network (graph 4). A new graph viewer window (Comparing Subnet of Protease-network and Subnet of Protease-network (graph 8)) will appear displaying the comparison graph. Nodes that belong to both graphs are colored peach, those only in the starting graph (the pathway to SipS-gene-off-CLc and SipT-gene-off-CLc) are colored purple, and those only in the compare to graph are colored cyan. (You can get this information from the color key at the right of the tool bar by mousing over the color of interest.) You can see the comparison graph in the context of the common parent (InitialNet for Protease-network) by clicking on the In Context button.
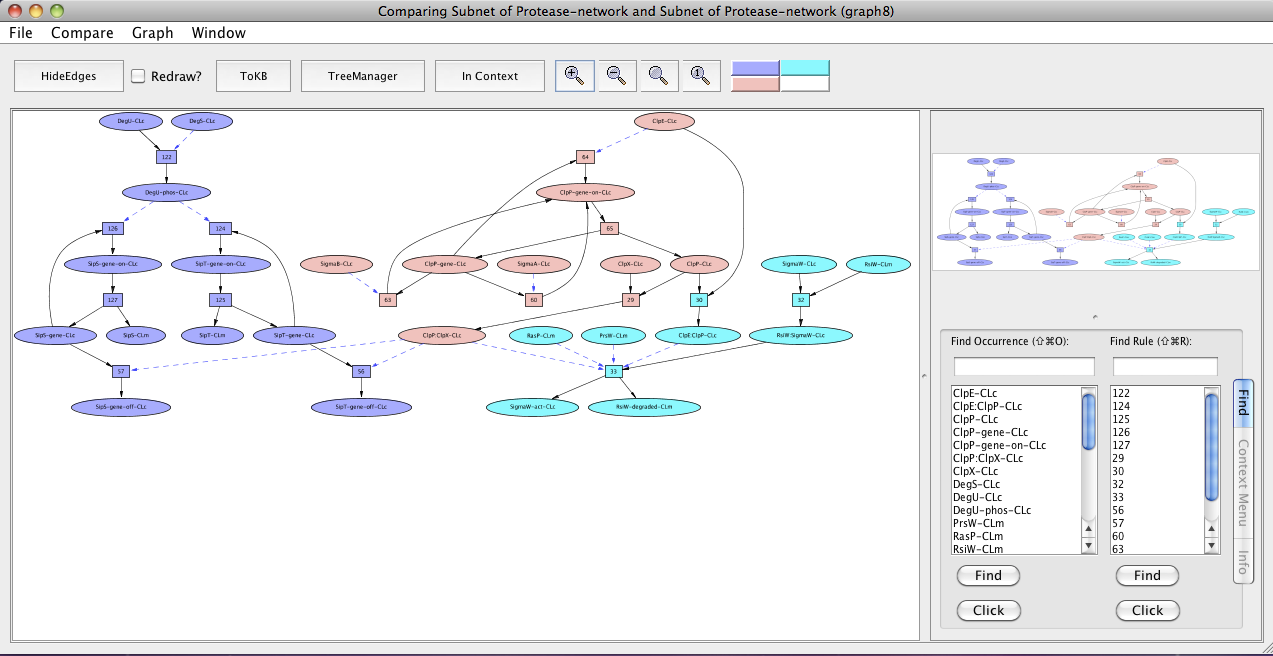
Comparing regulated intramembrane proteolysis (RIP) and the secretory precursor processing system.
In the comparison graph (graph 8), we see ClpP-gene-on-CLc, ClpP-gene, ClpP:ClpX-CLc, SigmaB-CLc, SigmaA-CLc, ClpE-CLc, ClpX-CLc and ClpP-CLc (peach colored) common to both the pathways.
To examine ClpP as a crucial target, we next develop an inhibition model that shows its relevance within the network. For this generate the RIP and secretory precursor processing system pathways as a single subnet
- Use the window menu to get back to the Protease-network window. Click on the menu labeled Window. Select "InitialNet for Protease-network (graph 2)" and this window comes to the front.
- Reset the goal selection: select the "Selections tab" (on the right of the information panel) and click the button labeled Reset All Selections at the bottom.
- Now make SigmaW-act-CLc, SipS-gene-off-CLc and SipT-gene-off-CLc as goals. You can do this in the Selections tab with the Set Goals option, click on All to display the list of occurrences. Find SigmaW-act-CLc, SipS-gene-off-CLc and SipT-gene-off-CLc in the list and check its box.
- Press Subnet in the tool bar.
- Reset the goal selection: select the "Selections tab" (on the right of the information panel) and click the button labeled Reset All Selections at the bottom.
- Click on the occurrence ClpP-CLc.
- Click on the avoid button in the information panel. The node will turn peach.
- Press the button labeled Subnet in the tool bar. Shortly a new window will appear displaying a graph representing a subnet without ClpP-CLc and nodes influenced by it.
- Press the In Context button and you will see the subnet in the context of the original graph (context nodes not in the subnet are white).
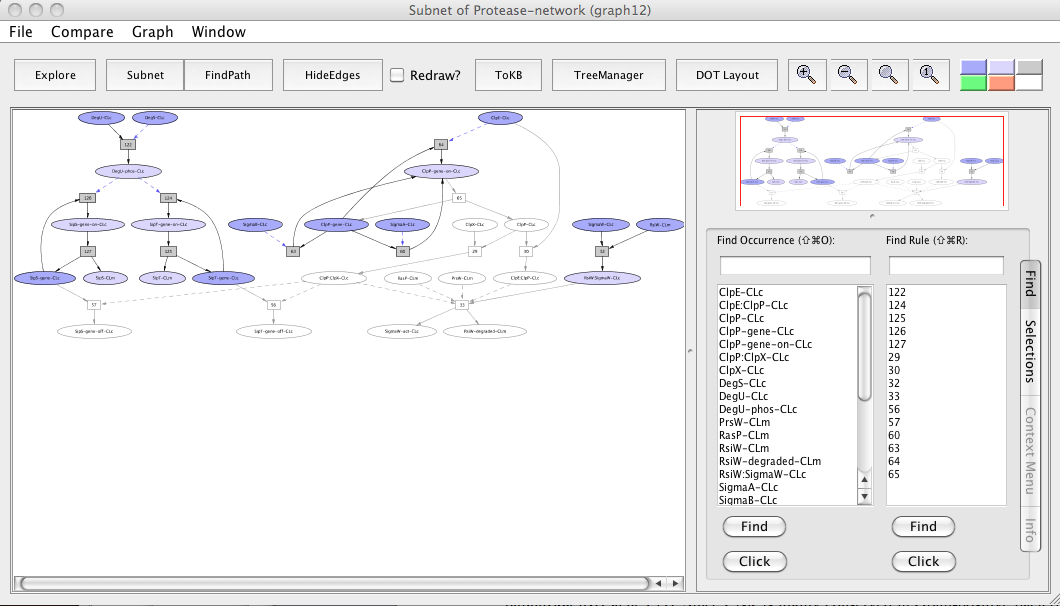
Subnet with ClpP avoided
In the subnet with ClpP avoided, we observe that the down-regulation of sipS and sipT genes is inhibited (uncolored ovals) whereas the up-regulation of sipS and sipT genes by phosphorylated DegU remains unaffected (colored ovals). We also observe that knocking out ClpP inhibited the SigmaW activation (uncolored oval) as RsiW does not get degradated and remains in a complex with SigmaW resulting in its inhibition (colored oval).
SrtA as Critical Component in Pathways
Similarly, we examine SrtA as a critical component by comparing pathways followed by knockout study. For this, follow same steps as mentioned before (for ClpP) with the exception of having different goals and avoids, as pathways studied are different here. We first find the S. aureus heme transport pathway and the pilus assembly in C. diphtheriae.
Find the subnet leading to Fe3+ (as the heme transport pathway involves the passage of heme across the bacterial cell wall to the cytosol and final release of Fe3+ into the cytosol). Use the window menu to get back to the "InitialNet for Protease-network (graph 2)" and reset the goal selection. Now generate the subnet by setting Fe3+-CLc as a goal. For finding the pathway involved in pilus assembly, reset your goal (Fe3+-CLc) in the "InitialNet for Protease-network (graph 2)" and set SpaABC-pilus-Sig as the goal now to generate the subnet. Now we can compare both these pathways and SrtA-CLm comes out as a shared component (peach colored) in the new window "Comparing Subnet of Protease-network and Subnet of Protease-network (graph 18)".
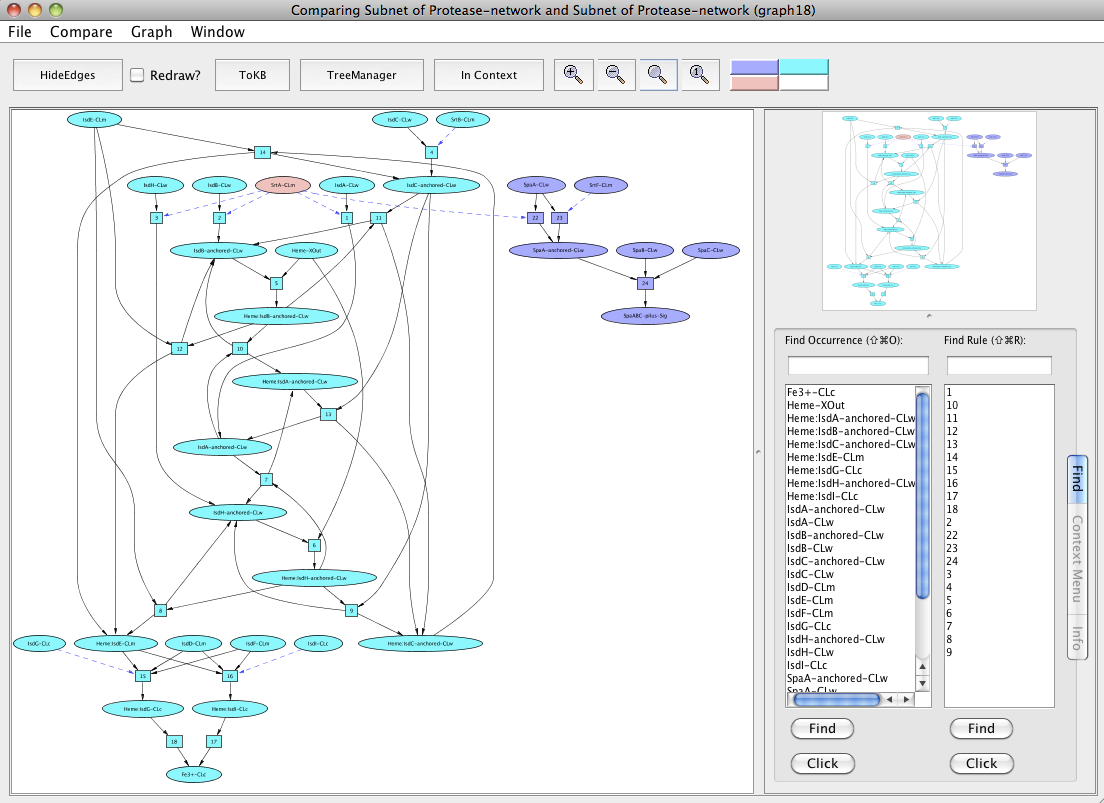
Comparing heme transport pathway and the pilus assembly.
The observed sharing of SrtA suggests asking: what happens if it is removed? For this, reset all selections and generate the heme transport pathway and the pilus assembly as a single subnet by setting Fe3+-CLc and SpaABC-pilus-Sig as goals. Next, in the resulting subnet (graph 20), again reset all selections. Click on the occurrence SrtA-CLm or select from the Selections tab and then click on Avoids. Click the Subnet in the tool bar and view the result in context to heme-pilus subnet by clicking to the In Context button.
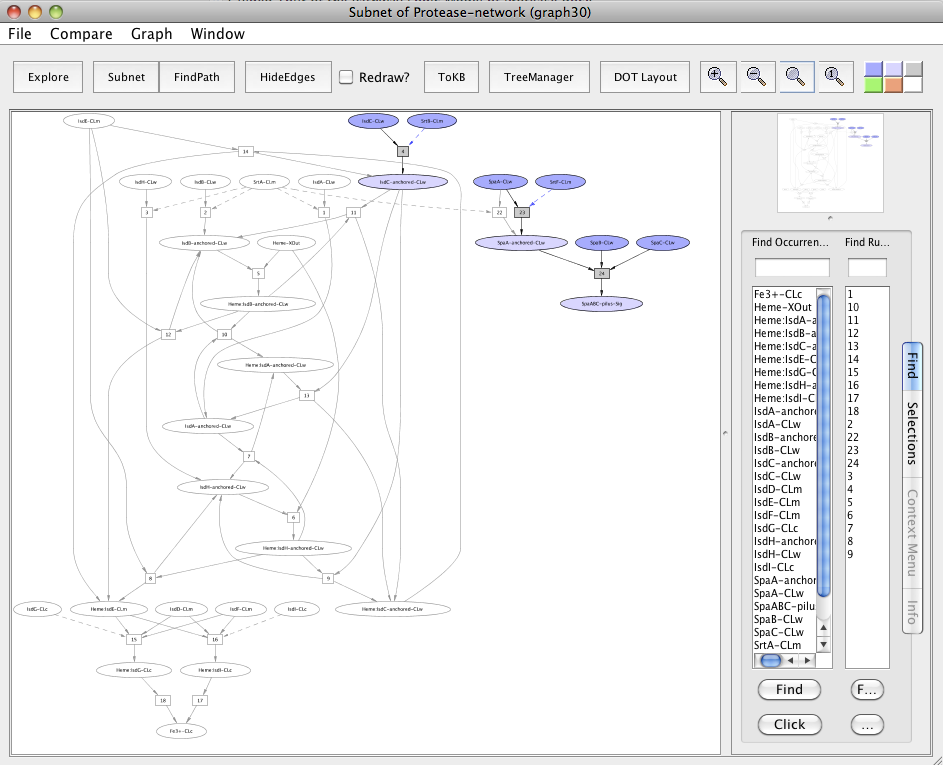
Subnet with SrtA avoided
In the subnet with SrtA avoided, we observe that this affected the heme transport pathway by inhibiting the SrtA mediated anchoring of the heme-binding Isd proteins namely IsdA, IsdB and IsdH to the cell wall (uncolored ovals). SrtA did not inhibit the pili formation due to the presence of a redundant pathway in which SrtF, a house keeping sortase, is involved in the Spa pili assembly (colored ovals).
Involvement of FtsH and ClpCP proteases in LonB protease expression
For this, use the window menu to get back to the Protease-network window. Click on the menu labeled Window and select "InitialNet for Protease-network (graph 2)" and this window comes to the front. Reset the goal selection. Now make LonB-gene-on-CLc as a goal. Press FindPath in the tool bar. Clicking on the FindPath button in the tool bar will find one path (usually the shortest) leading to lonB gene activation.
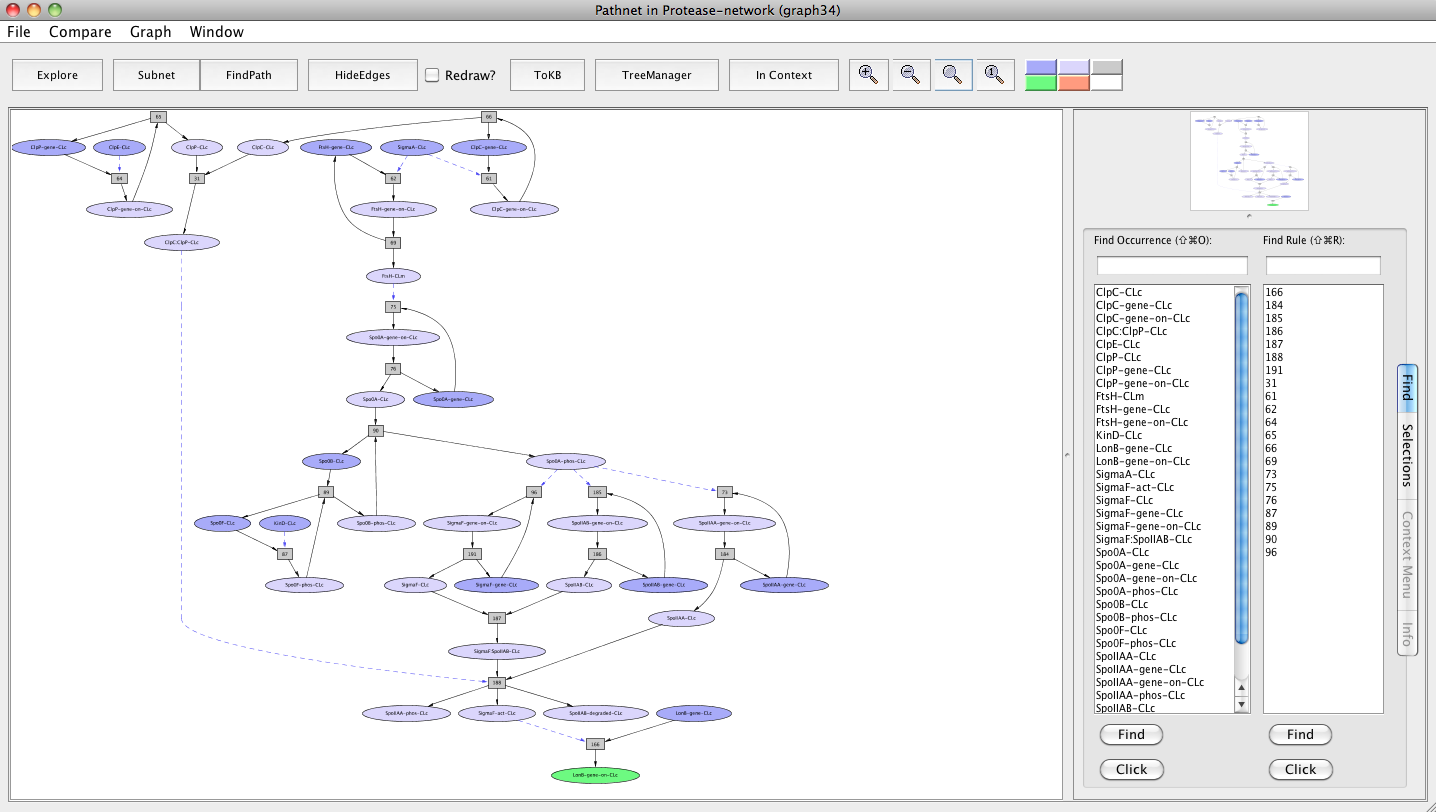
Screen shot of a pathway activating lonB gene
As seen in the resulting graph "Pathnet in Protease-network (graph 34)", both FtsH and ClpCP proteases up-regulate the lonB gene expression through two different pathways that converge at the transcription factor Sigma F. ClpCP contributes by causing the degradation of SpoIIAB, which leads to the disaggregation of the complex that sequesters Sigma F. FtsH contributes by influencing the production of Spo0A and its activation by degrading the phosphatase Spo0E that dephosphorylates and inhibits Spo0A. Spo0A has been shown to be involved in the synthesis of Sigma F.
Involvement of FtsH in the expression Bpr, Epr, Mpr, NprB, NprE, Vpr and WprA extracellular proteases
After resetting all selections in the "InitialNet for Protease-network (graph 2)", make Bpr-gene-on-CLc, Epr-gene-on-CLc, Mpr-gene-on-CLc, NprB-gene-on-CLc, NprE-gene-on-CLc, Vpr-gene-on-CLc and WprA-gene-on-CLc from the Selections tab as goals. Click on the FindPath button in the toolbar and you get the path leading to the expression of these genes.
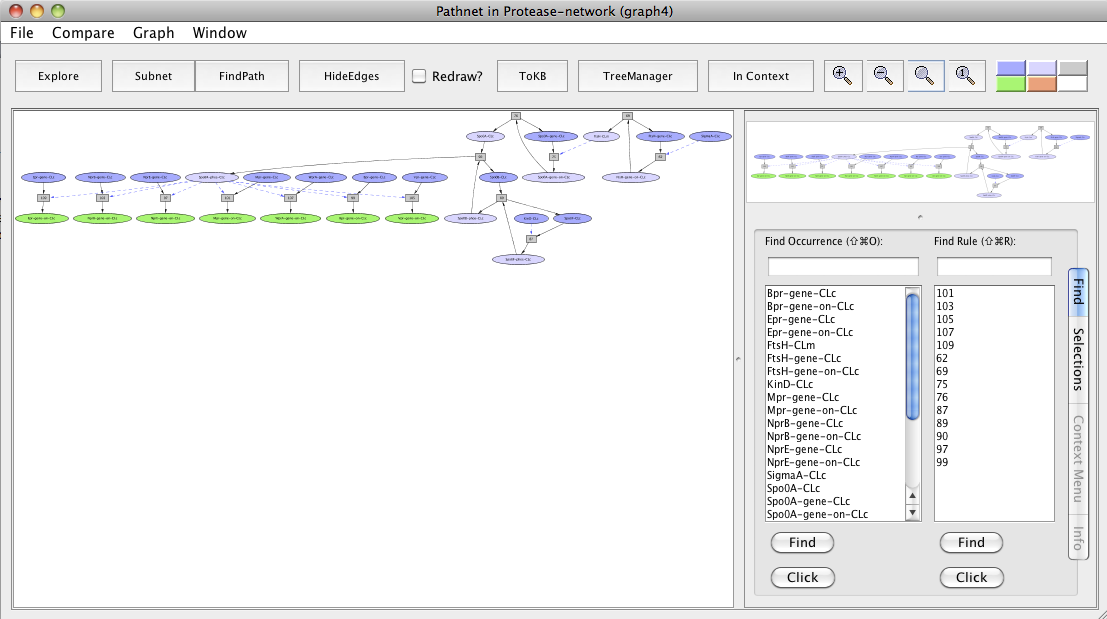
Screen shot of a pathway activating Bpr, Epr, Mpr, NprB, NprE, Vpr and WprA extracellular proteases
As seen in the resulting graph "Pathnet in Protease-network (graph 4)", FtsH transcriptionally activates Spo0A and its protein activity by degrading the phosphatase Spo0E. Spo0A is involved in the production of these extracellular proteases.
Predicting regulatory roles for FtsH and ClpCP in toxin production
For this, again reset all selections in the "InitialNet for Protease-network (graph 2)". Next, we find all the paths that would lead to the down-regulation of abrB gene and sporulation. For this click AbrB-gene-off-CLc and Sporulation-Sig as goals. Click on the Subnet button in toolbar. This will generate a subnet leading to these goals. This subnet represents the pathways from the B. subtilis, the Gram-positive sporulating model organism.
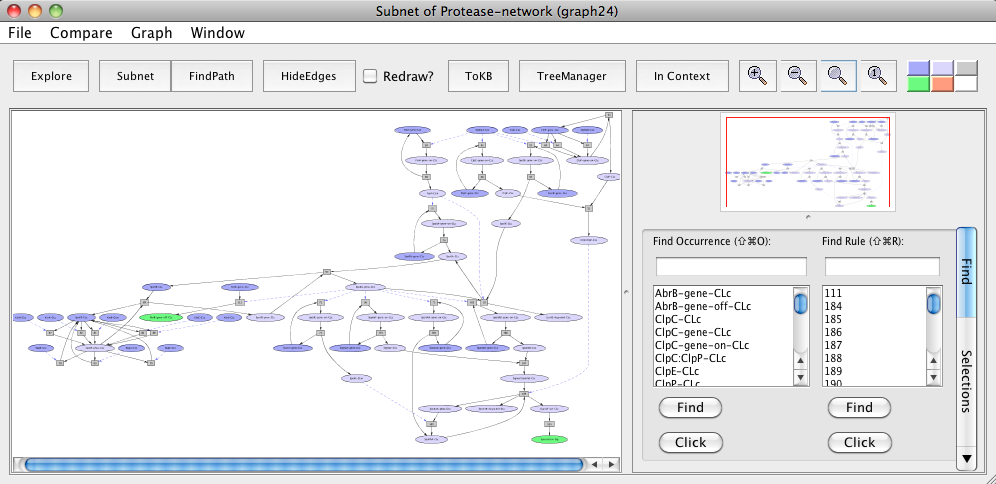
Pathways leading to abrB gene downregulation and sporulation in B. subtilis based sporulation model.
It has been shown that in B. anthracis, toxin production involves down-regulation of abrB gene by Spo0A and in C. perfringens, the enterotoxin is produced during the sporulation process. We mapped components of these pathways to their orthologs in pathways shared by B. subtilis (represented above in the sporulation model "Subnet of Protease-network (graph 24)").
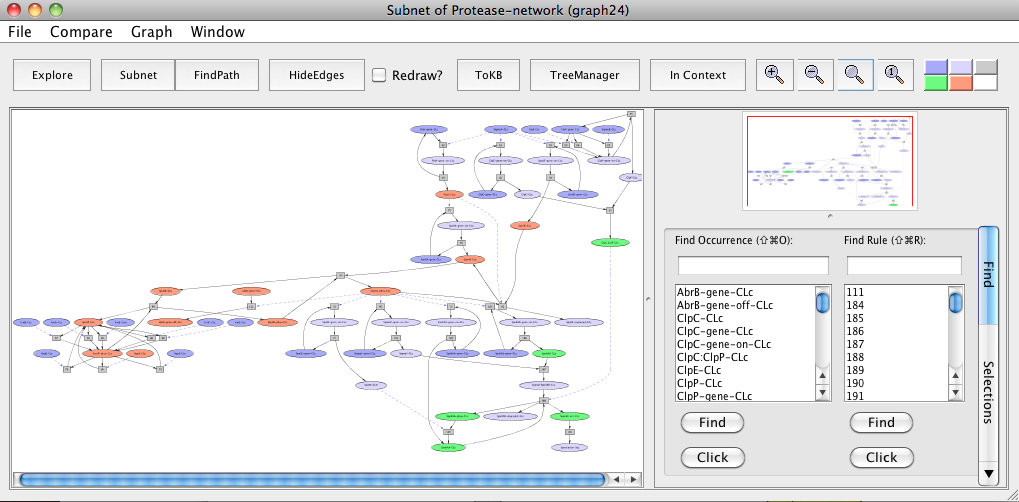
Mapping of pathway components of B. anthracis and C. perfringens to orthologs in pathways shared by B. subtilis. Peach color represents orthologs in B. anthracis and green color represents orthologs in C. perfringens. Note that the orthologs are highlighted to make it easier for the reader to locate molecules of interest. These can easily be located in PLA using the Find tab.
Regulatory role of FtsH in Spo0A phosphorylation and abrB gene expression
Based on the pathway memberships of FtsH and ClpCP orthologs in this subnet, we predict FtsH and ClpCP to play a role in toxin production by modulating Spo0A and Sigma F respectively in these pathogenic bacteria. To examine this hypothesis, in the same "Subnet of Protease-network (graph 24)", again reset all selections. Click on the occurrence FtsH-CLm or select from the Selections tab and then click on Avoids. Click the Subnet in the tool bar and view the result in context to parent subnet (graph 24) by clicking to the In Context button.
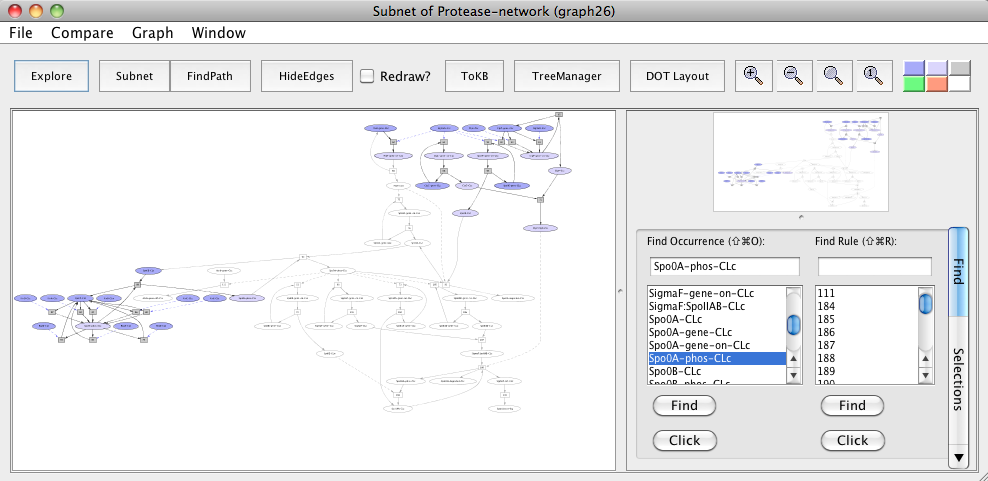
Subnet with FtsH avoided
In the generated subnet "Subnet of Protease-network (graph 26)", we see that there is inhibition of Spo0A phosphorylation and elimination of its repressive effect on abrB gene expression (uncolored ovals) when FtsH is knocked out in the subnet.
Regulatory role of ClpCP protease in SigmaF activation
Similarly, now we avoid ClpC:ClpP-CLc (after resetting all selections in "Subnet of Protease-network (graph 24)") and see its importance within the subnet.
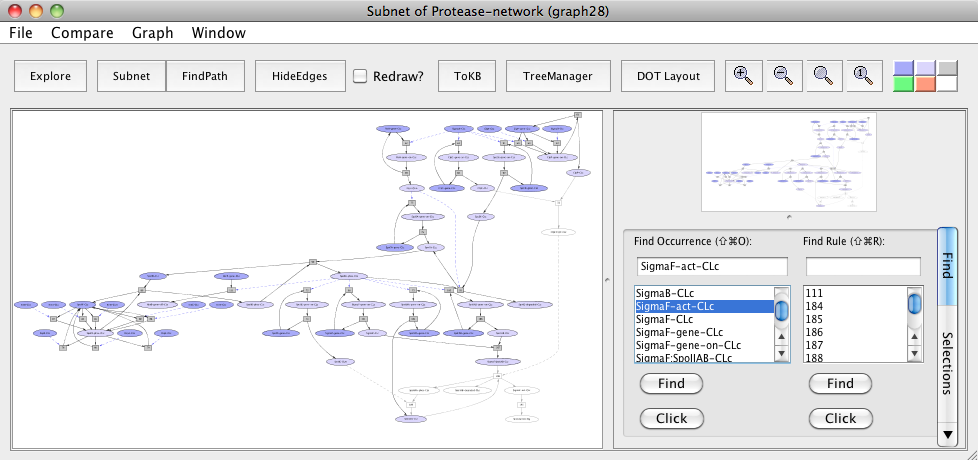
Subnet with ClpC:ClpP avoided
In the resulting subnet "Subnet of Protease-network (graph 28)", we see that SpoIIAB does not get degraded leading to the inhibition of Sigma F (uncolored ovals) when ClpCP protease is knocked out in the subnet.
A possible role for CtsR in the inhibition of B. subtilis sporulation
Reset all selections in the "InitialNet for Protease-network (graph 2)". We find the pathways that would lead to the down-regulation of clpC, clpP, ftsH genes and also sporulation. For this click ClpC-gene-off-CLc, ClpP-gene-off-CLc, FtsH-gene-off-CLc and Sporulation-Sig as goals. Click on the FindPath button in toolbar. This will generate a pathnet leading to these goals. This pathnet represents the sporulation pathways from the B. subtilis. We see that CtsR-CLc is involved in ClpC-gene-off-CLc, ClpP-gene-off-CLc and FtsH-gene-off-CLc. Now, we model these down-regulations of clpC, clpP, ftsH genes by CtsR by avoiding ClpC, ClpP and FtsH proteins in this pathnet.
For this, reset all selection in this graph. Click ClpC-CLc, ClpP-CLc, FtsH-CLc and make these as avoids. Click the Subnet button and this generates the "Subnet of Protease-network (graph 36)".
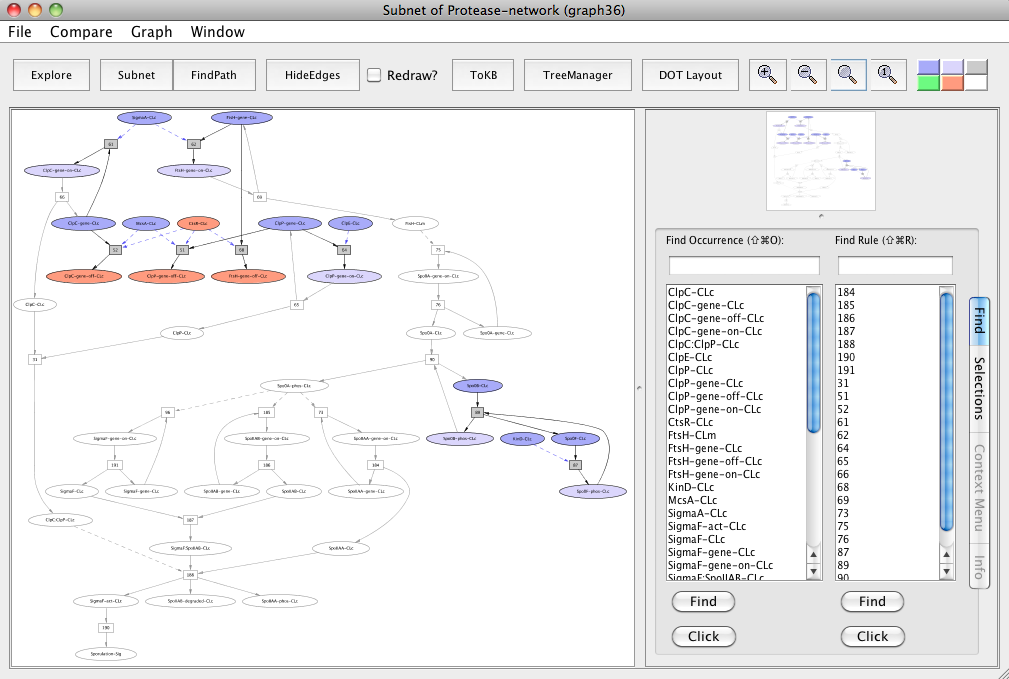
Note that CtsR-CLc, ClpC-gene-off-CLc, ClpP-gene-off-CLc and FtsH-gene-off-CLc are colored peach to make it easier for the reader to locate molecules of interest. These can easily be located in PLA using the Find tab.
In the resulting subnet "Subnet of Protease-network (graph 36)", we observe that knocking out ClpC, ClpP and FtsH proteins leads to the inhibition of sporulation (uncolored ovals).