STM8: A Pathway Logic Model of Intracellular Signal Transduction
Table of Contents
- Introduction
- The STM8 Network Collection
- Demo: How to use PLA to examine the Death Network
- Conclusion
Introduction
STM8 is a formal knowledge base containing information about the changes that occur in the proteins inside a cell in response to exposure to receptor ligands, chemicals, or various stresses. STM8 is represented in Pathway Logic (PL) and can be explored using the Pathway Logic Assistant (PLA). The key features of STM8 (and PLA) that distinguish it in various ways from other signal transduction pathway knowledge bases and viewers (such as Reactome, KEGG, Cytoscape, CellDesigner) are:
- The rules in the response networks are derived from experiments.
The experimental evidence for each rule is supplied in its evidence page. The evidence is in datum form. Each datum represents a result from a experiment published in a refereed journal. Datums are written in a shorthand designed to be both readable by biologists and parsible by a computer. More about datums and the datum knowledge base can be found here. In some cases, the evidence is weak or incomplete or simply based on correlations. Some attempt has been made to point out the weak spots but the bulk of the effort has gone into collecting and presenting the data in such a way that the biologist can decide for himself. - STM8 uses a Petri net representation to analyze and display the networks.
In a Petri net, both the biochemical components, called occurrences, and the rules are represented explictly. An occurrence represents a protein, gene or chemical with its modification state and location. A Petri net gives a visual representation of the flow of information over time. Time flows roughly from top to bottom (as opposed to interaction networks, such as displayed by cytoscape, that have no idea of time). Occurrences are only displayed once. (Cytoscape and Cell Designer allows you to put the same entity on the graph as many times as you want, making it difficult to see at a glance what a particular occurence is doing.) - All the networks use the same nomenclature allowing combination of networks.
Pathway Logic (PL) models are written in Maude which is formal system based on Rewriting Logic. This means that every term used in the rules and datums must have a unique name and a sort, and this is checked by Maude. When fuzzy language is required variables can be used and ambiguity about members of a protein family can be represented by naming the family and linking it to family members. Signal transduction steps are represented as rewrite rules that naturally model change of state. Meta data links rules to their evidence and biomolecules to synonyms and reference database entries. - There are no predefined/named pathways.
Each response network reports the behavior of cultured cells to a single ligand, chemical, or stress. It applies to any type of cell that contains the all of the occurrences listed in the initial state. For example, the Egf response network is applicable to epithelial cells that express the Egf Receptor whereas the IL2 response network is only applicable to lymphocytes that express the IL2 receptor. Subnetworks and pathways in a response network can be discovered and visualized on demand by specifying outcomes of interest. - The focus is on human proteins and cells.
If experiments are done in mouse cells or use mouse proteins, the proteins and modification sites are converted into the closest human homolog. In cases where there is not close homolog the species name is attached to the protein name using "!". Examples are: Naip5!mouse and Ctxb!V.cholerae. - The networks are not kinetic models.
They represent possible change over time, what must happen before, what is the state after, but not how long it takes or concentrations of participants.
The STM8 Network Collection
Cell biologists spend a lot of time throwing things (stimuli) at cells in culture and studying the results. The STM8 Response Networks are formal representations of conclusions that can be made from such experiments. These representations constitute executable models that have natural graphical visualizations. The STM8 collection also includes a phenotype (story) network (the Death network). Phenotype networks focus on a particular endpoint or goal and may have multiple stimuli, in contrast to the response networks that have a single stimulus and may have many different endpoints. In either case, the size (number of rules and datums) of each network depends on the available literature and the interests of our clients.
Response networks
- AADep: Amino Acid Deprivation (usually Histidine and/or Leucine deprivation) is used as a mechanism to deactivate Mtor kinase activity and cause a decrease in protein synthesis. (21 rules, 35 occurrences)
- Adriamycin: Adriamycin (aka Doxorubicin) is a chemotherapy medication used to treat cancer. It works by intercalation with DNA and inhibiting transcription. It is used to elicit the DNA damage response in cells and usually causes cell death. (16 rules, 35 occurrences)
- Age: Advanced Glycosylation Endproducts are proteins or lipids that become glycated as a result of exposure to sugars. These bind to the RAGE receptor and lead to activation of inflammatory genes. (18 rules, 33 occurrences)
- Aniso: Anisomycin is an antibiotic used by cell biologists to activate the stress-activated protein kinases, P38s and Jnks. It interferes with protein and DNA synthesis by inhibiting peptidyl transferase or the 80S ribosome system. (33 rules, 61 occurrences)
- Atox: Anthrax toxin is a three-protein exotoxin secreted by virulent strains of the bacterium, Bacillus anthracis—the causative agent of anthrax. Anthrax toxin is composed of a cell-binding protein, known as protective antigen (PA), and two enzyme components, called edema factor (EF) and lethal factor (LF). This network contains some rules without evidence. These describe the steps in which PA translocates EF and LF into the cell. The steps were worked out in the 1980s so finding the experiments is challenging. (19 rules, 35 occurrences)
- Bleomycin: Bleomycin is a chemotherapy medication used to treat cancer. It works by acts by induction of DNA strand breaks. It is used to elicit the DNA damage response in cells and usually causes cell death. (8 rules, 16 occurrences)
- Cd40: Cd40Lg is a protein that is expressed on the surface of activated T-cells and binds to Cd40 on the surface of antigen presenting B-cells. To avoid confounding factors that arise from using one cell to activate another, the response to Cd40Lg is commonly studied by treating cells with an antibody to Cd40. (55 rules, 51 occurrences)
- CpG: CpG oligodeoxynucleotides (or CpG ODN) are short single-stranded synthetic DNA molecules that contain a cytosine triphosphate deoxynucleotide ("C") followed by a guanine triphosphate deoxynucleotide ("G"). The "p" refers to the phosphodiester link between consecutive nucleotides, although some ODN have a modified phosphorothioate (PS) backbone instead. CpG is used to activate the the pattern recognition receptor (PRR) Toll-Like Receptor 9 (TLR9). (25 rules, 54 occurrences)
- Csf1: Csf1 (Colony stimulating factor 1), also known as macrophage colony-stimulating factor (M-CSF), is a secreted cytokine which causes hematopoietic stem cells to differentiate into macrophages or other related cell types. Interaction of Csf1 with its membrane receptor (Csf1R) causes cells to proliferate. (28 rules, 57 occurrences)
- Egf: Egf (Epidermal Growth Factor) stimulates cell growth and differentiation by binding to its receptor, EgfR. (255 rules, 325 occurrences)
- Etoposide: Etoposide is a chemotherapy medication used to treat cancer. It forms a ternary complex with DNA and the topoisomerase II enzyme (which aids in DNA unwinding), prevents re-ligation of the DNA strands, and by doing so causes DNA strands to break. It is used to elicit the DNA damage response in cells and usually causes cell death. (15 rules. 19 occurrences)
- FasL: Fas ligand or FasL is a homotrimeric type II transmembrane protein expressed on cytotoxic T lymphocytes. It signals through trimerization of FasR, which spans the membrane of the "target" cell. This trimerization usually leads to apoptosis and cell death. (9 rules, 16 occurrences)
- H2O2: Hydrogen peroxide is used to induce the DNA damage response in cells. (45 rules, 68 occurrences)
- Hgf: Hgf (Hepatocyte growth factor or scatter factor) regulates cell growth, cell motility, and morphogenesis by activating a tyrosine kinase signaling cascade after binding to the proto-oncogenic c-Met receptor (HgfR). (48 rules, 95 occurrences)
- Hydroxyurea: Hydroxyurea is an antimetabolite that selectively inhibits ribonucleoside diphosphate reductase, an enzyme required to convert ribonucleoside diphosphates into deoxyribonucleoside diphosphates, thereby preventing cells from leaving the G1/S phase of the cell cycle. (9 rules, 19 occurrences)
- Ifnab: Ifnab is the PL family name for type I interferons that bind to the Ifna receptor that consists of IfnaR1 and IfnaR2. Binding of the type I interferons to the receptor causes the upregulation of many genes associated with an anti-viral immune response. (119 rules, 123 occurrences)
- Ifng: Interferon gamma is a dimerized soluble cytokine that is the only member of the type II class of interferons. Binding of Ifng to its receptor causes the upregulation of many genes producing a variety of cellular responses. (64 rules, 79 occurrences)
- Igf1: Insulin-like growth factor 1 is a hormone similar in molecular structure to insulin. IGF-1 binds to at least two cell surface receptor tyrosine kinases: the IGF-1 receptor (IGF1R), and the insulin receptor. Its primary action is mediated by binding to its specific receptor, Igf1R, which is present on the surface of many cell types in many tissues. Binding to the IGF1R stimlulates proliferation. (24 rules, 53 occurrences)
- IL1: Interleukin 1 is the PL family name for IL1a and IL1b. Binding of these ligands bind to IL1R1 and its coreceptor IL1Rap causes the upregulation of proinflammatory cytokines. (285 rules, 139 occurrences)
- IL2: Interleukin 2 mediates its effects by binding to IL-2 receptors, which are expressed by lymphocytes. It causes T-cells to proliferate. (49 rules, 102 occurrences)
- IL4: Interleukin 4 is a cytokine that stimulates the proliferation of activated B-cells (31 rules, 66 occurrences)
- IL6: Interleukin 6 signals through a cell-surface type I cytokine receptor complex consisting of the ligand-binding IL6R chain and the signal-transducing component Gp130. (9 rules, 16 occurrences)
- IL12: Interleukin 12 is a heterodimer made of IL12a and IL12b which binds to the IL12 heterodimeric receptor made of IL12Rb1 and IL12Rb2. (18 rules, 38 occurrences)
- IL17: Interleukin 17 is a proinflammatory cytokine that upregulates other proinflammatory cytokines. (23 rules, 43 occurrences)
- IL22: Interleukin 22 is a member of the cytokine IL10 superfamily, a class of potent mediators of cellular inflammatory responses. (15 rules, 32 occurrences)
- Ins: Insulin is a peptide hormone that binds to the Insulin Receptor and causes an increase in proliferation and metabolic processes. (43 rules, 94 occurrences)
- IRad: Treating cells with Ionizing Radiation causes double strand DNA breaks. It is used to elicit the DNA damage response in cells and usually causes cell death. (134 rules, 75 occurrences)
- Lps: Lipopolysaccharide is the major component of the outer membrane of Gram-negative bacteria. Lps is used to activate the the pattern recognition receptor (PRR) Toll-Like Receptor 9 (TLR4). (339 rules, 320 occurrences)
- NCS: Neocarzinostatin is secreted by Streptomyces macromomyceticus. When added to cells it induces sequence-specific single and double strand breaks in DNA. (15 rules, 27 occurrences)
- NDV: Infection of human cells with NDV (Newcastle Disease Virus) causes the upregulation and secretion of Ifnb1. It is used to determine the ability and mechanism that other viruses use to prevent the Ifnb1 response. (23 rules, 42 occurrences)
- Ngf: Nerve Growth Factor binds to two very different receptors. The first receptor (TrkA) is a tyrosine kinase receptor that leads to cell differentiaion when activated. NgfR can mediate cell survival as well as cell death of neural cells. (50 rules, 97 occurrences)
- Pdgf: Platelet-derived growth factor is a dimeric glycoprotein that can be composed of two A subunits (Pdgfa), two B subunits (Pdgfb), or one of each. Binding of Pdgf to the PdgfR (a hetero or homodimer of PdgfRa and PdgfRb) leads to cell proliferation. (33 rules, 69 occurrences)
- PMA: Phorbol 12-Myristate 13-Acetate) is a diester of phorbol and a potent tumor promoter often used to activate the signal transduction enzyme protein kinase C (PKC). (47 rules, 92 occurrences)
- PolyIC: Polyinosinic:polycytidylic acid is a synthetic analog of double-stranded RNA, which is present in some viruses. It can bind to TLR3, Rig1, Mda5, and Pkr causing the upregulation of inflammatory cytokines. (54 rules, 15 occurrences)
- Rig1: The cellular responses to activation of Rig1 are measured using the specific agonist 5' triphosphate double stranded RNA or expression of a constitutively active Rig1 mutant. This system is commonly used to determine how viral proteins highjack the host antiviral response. (8 rules, 16 occurrences)
- SEV: Infection of human cells with SEV (Sendai Virus) causes the upregulation and secretion of Ifnb1. It is used to determine the ability and mechanism that other viruses use to prevent the Ifnb1 response. (45 rules, 80 occurrences)
- SFTSV: Infection of human cells with SEV (Severe Fever with Thrombocytopenia Syndrome Virus) causes the upregulation and secretion of Ifnb1. It is used to determine the ability and mechanism that other viruses use to prevent the Ifnb1 response. (37 rules, 71 occurrences)
- Sorbitol: Addition of high concentrations of Sorbitol to cell medium lead to high osmolarity and the activation of P38s and Jnks. (19 rules, 38 occurrences)
- Tgfb1: Transforming growth factor beta 1 is a secreted protein that performs many cellular functions, including the control of cell growth, cell proliferation, cell differentiation, and apoptosis. (90 rules, 117 occurrences)
- UV: Treating cells with UV (Ultraviolet Light) causes single strand DNA breaks. It is used to elicit the DNA damage response in cells and usually causes cell death. (82 rules, 135 occurrences)
- Tnf: Binding of Tnf (Tumor necrosis factor) to TnfR1 and/or TnfR1 causes the translocation of transcription factors such as Rela, Jun, and Atf2 to the nucleus where they participate in gene regulation. (251 rules, 234 occurrences)
Story networks
Projects often require for networks that have a particular outcome (such as apoptosis) but not a specific stimuli. Story (phenotype) networks are built by collecting statements made in review articles, translating them into rules, and using PLA to display them. An example of a story is the Death Network assembled for the Iarpa FunGCat project:
- Death: The Death Network works backward from the cellular phenotypes Apoptosis, Necroptosis, and Pyroptosis. It combines statments from review articles combined with rules from the Tnf, Lps, FasL, and Atox response networks. (161 rules, 214 occurrences)
The review articles used for Death Network are:
- PMID:25150011 Regulated cell death: signaling and mechanisms. Ashkenazi A, Salvesen G. Annu Rev Cell Dev Biol. 2014;30:337-56
- PMID:26626938 Cell Death Signaling. Green DR, Llambi F. Cold Spring Harb Perspect Biol. 2015 Dec 1;7(12) PMID:28462525 Caspase-8: regulating life and death. Tummers B, Green DR. Immunol Rev. 2017 May;277(1):76-89
- PMID:28855232 Molecular mechanisms of inflammasome signaling. Mathur A, Hayward JA, Man SM. J Leukoc Biol. 2018 Feb;103(2):233-257
Once the network is assembled, we try to verify it by collecting the experimental evidence from the supporting references. If experimental evidence is found that supports the statement then the rule is considered valid. If the experimental evidence does not support the statement or if the reference is another review article, then the rule is considered to be unsupported and colored yellow in the PLA display. In either case, the rules will have links to evidence pages containing the statements from the review article, the PMIDs of the supporting references, and any datums that are relevant.
In many cases, the supporting reference (the numbers represent PMIDs) will be marked "done" but there will not be any datums in the evidence page. That is because we could not find any connection between the statement and the experimental results. You can check for yourself by going to http://datum.csl.sri.com and entering the PMID into the search box. This will bring up all the datums curated from the reference.
Why tell a story? Consider Pyropotosis from the evidence. Most of the experiments from the review articles are done in mouse bone marrow derived macrophages and are about mouse proteins involved in inflammasome formation. The end goal of pyroptosis is the secretion of mature IL1b. Why are there so few experiments using human cells and proteins? One of the excuses is that obtaining bone marrow macrophages from human is not practical. But immunology text books tell us that IL1b is also secreted by epithelial cells (Janeway), fibroblasts, and hepatocytes (Abbas). Now that we have our story, we know where the gaps in the evidence are (see the yellow rules) and we have descriptions of the experiments that were done to put the story together. Given the existing preliminary data, it would be simple to design experiments using a human cell line and see how the story plays out in humans.
Demo: How to use PLA to examine the Death Network
This demo assumes that the user is already familiar with the use of PLA as described in the SmallKB guide and the PLA reference manual . In the following guided tour, double click on a figure to see an enlarged version. Single click to restore the figure to its original size.
Getting started
Download the PLA STM8 Launcher from PLA Online. Follow instructions on the page to get around security barriers and start the launcher. A launcher window will open showing the collection of STM8 networks. Clicking on a network name will display information about the network.
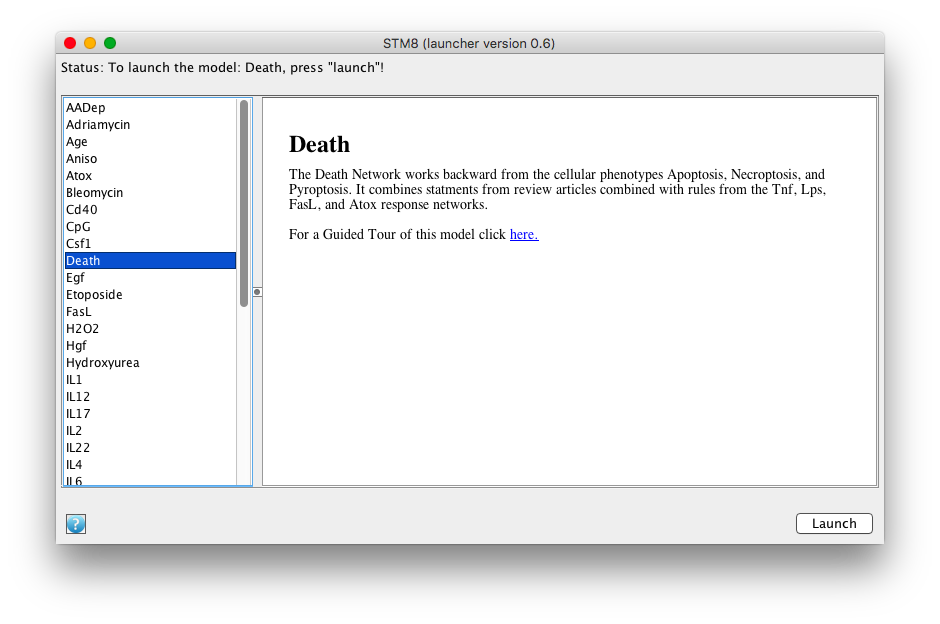
Screen shot of the STM8 launcher with the Death network selected
Select the Death network and click on the launch button.
When PLA starts up, a knowledge base manager (KBManager) window (title: Death Manager) appears in the upper left corner of your screen. The KBManager displays a list of available knowledge bases (rule sets). "RKB" is selected by default and will be highlighted in blue.
Start by selecting a predefined dish: press the "Select Dish" button on the right side of the KBManager window. This produces a menu with two options: "Edit" and "PreDefined". Select (click on) "PreDefined". This produces a (sub)menu. Select "DeathDish" (by clicking on the corresponding menu item).
Shortly a PLA viewer window with tab titled graph2:DeathDish will appear on your screen displaying the Death Network. [Note that the graph numbers in titles may differ if you have created graphs or nets in addition to those discussed in the demo or restarted with a fresh PLA. This is fine.]
The PLA display
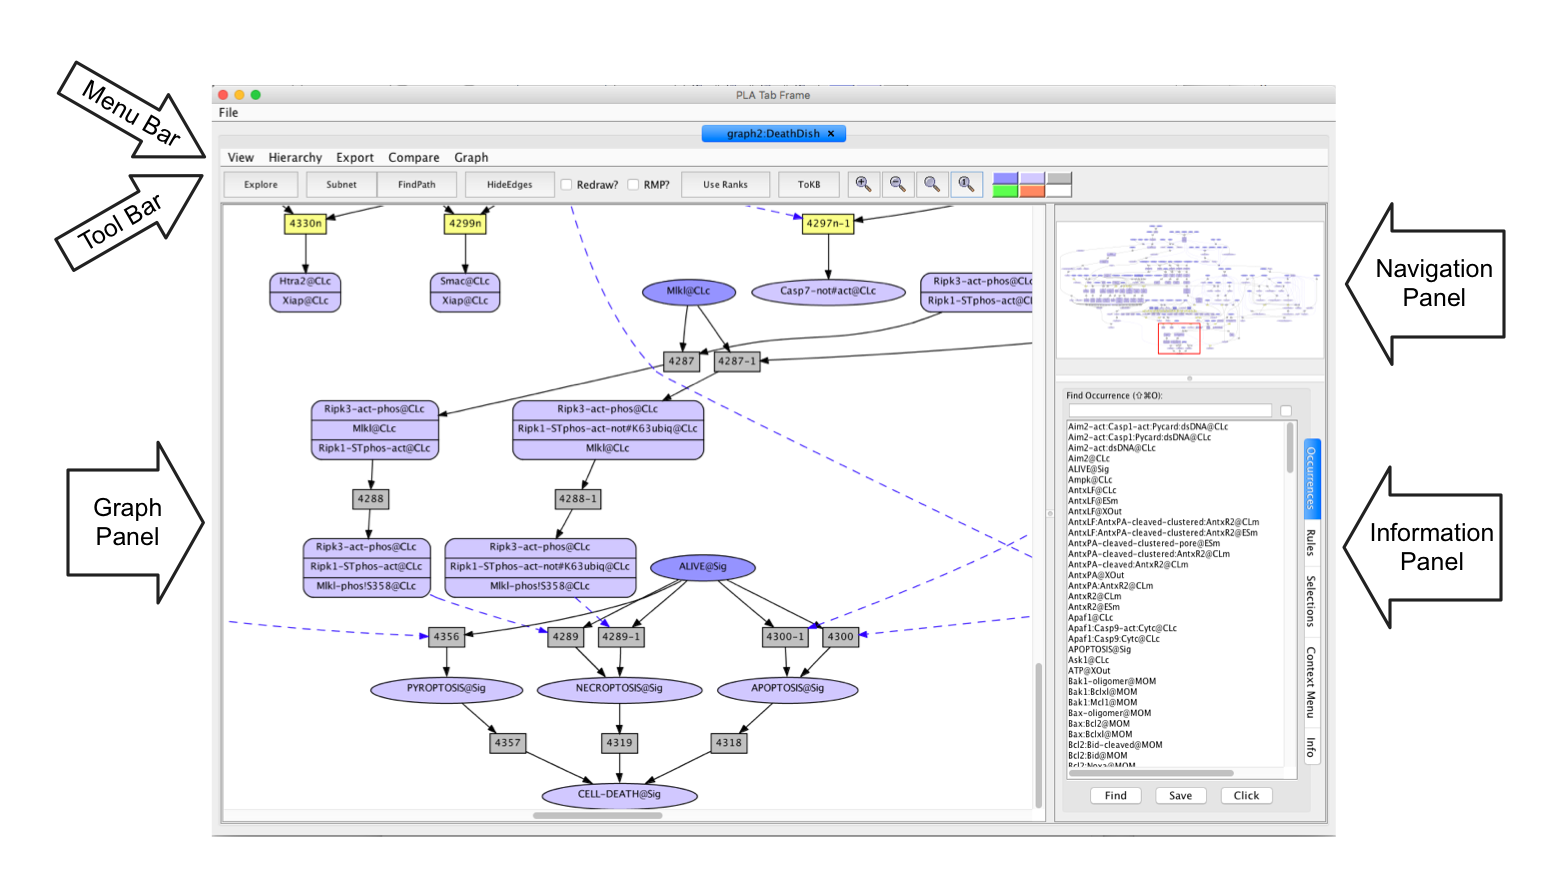
Screen shot of the Death Network displayed in the PLA tab window
- Menu Bar: This is the upper row of the PLA window. It provides functionality to select the active tab (when you have created multiple networks or paths), to export a network in different forms, compare networks, and control the graph display parameters.
- Tool Bar: This is the second row of the PLA window. It provides access to analysis commands (Explore, Subnet, FindPath) illustrated later. The Zoom buttons allow you to change the magnification: + zooms in; - zooms out; blank: fits the entire network in the graph panel; and 1: resets zoom to default which is the size that makes the occurrence and rule labels readable on most screens. The Hide Edges Button controls the set of edges used to lay out the graph. Logically redundant edges can be removed from the graph layout by clicking on the 'HideEdges' button in the tool bar. Roughly speacking, an edge is logically redundant if its path can be decomposed into multiple edges. For example, if there are edges connecting A → B → C and A → C, then the edge leading from A to C will be removed, as it is logically implied by the other two edges. If the Redraw? box is checked before "HideEdges" is used, the layout of the graph will be adjusted to make it more readable.
- Navigation Panel: In the upper right of the PLA graph window is a thumbnail sketch of the full graph with a red rectangle delineating the part of the graph visible in the graph panel (on the left). Drag the rectangle around or click on different points in the thumbnail to change what is visible in the graph panel. You can also use the scroll bars on the graph panel to control what is visible.
- Graph Panel: The Graph Panel is in the lower left of the PLA window. Some of the arrows the lead to nodes amy not be visible in the current view. To find out what is at the other end, click on the arrow. To go to the other end, double-click on the arrow. The information window (Context Menu) tells you what the node at the other end is, and also provides some options for re-centering the graph.
- Information Panel: In the lower right of the PLA graph window is an information pane with several tabs. The Occurences and Rules tabs enable the user to search for nodes. The Selections tab is used to set Goals and Avoids for creating Subnets and Finding Paths. The Context Menu and Info Tabs are used to diplay responses to queries about the graph. Use of these features are described below.
About the Petri Net Representation
A network of reactions is displayed as a graph with two kinds of nodes. Ovals represent occurrences—proteins or chemicals in a specific state and location. For example the oval labeled Casp7-act@CLc represents the protein Casp7 in its active state located on the cytoplasm (CLc). We use the following notation:
LocationsCLm --- Plasma membrane CLo --- Stuck to the outside of the plasma membrane CVc --- Stuck to the cytoplasmic side of the membrane of acytoplasmic vesicle ERl --- Endoplasmic reticulum lumen ERm --- Endoplasmic Reticulum membrane ESm --- Endosome membrane GOm --- Golgi Apparatus membrane MIS --- Mitochondrion intermembrane space MIX --- Mitochondrion matrix MOM --- Mitochondrion outer membrane NUc --- Nuclear membrane Sig --- A pseudo location for phenotypesReceptor Complexes
Cd40C --- forms in response to Cd40Lg binding to Cd40
Csf1RC --- forms in response to Csf1 binding to Csf1R
EgfRC --- forms in response to Egf binding to EgfR
FasRC --- forms in response to FasL binding to FasR
GP130C --- forms in response to IL6 binding to Gp130 and IL6R
HgfRC --- forms in response to Hgf binding to HgfR
IfnaRC --- forms in response to members of the Ifna family or Ifnb1 binding to IfnaR2 and IfnaR1
IfngRC --- forms in response to Ifng binding to IfngR1, Jak1, IfngR2, and Jak2
Igf1RC --- forms in response to Igf1 binding to Igf1R
IL1R1C --- forms in response to IL1 binding to IL1R1 and IL2Rap
IL2RC --- forms in response to IL2 binding to IL2Rb, IL2Ra, and IL2Rg
IL4RC --- forms in response to IL4 binding to IL4R IL2Rg
IL12Rb1C --- A preassembled complex consisting of IL12Rb1 and Tyk2
IL12Rb2C --- A preassembled complex consisting of IL12Rb2 and Jak2
IL12RC --- forms in response to IL12 binding to IL12Rb1, Tyk2, IL12Rb2, and Jak2
IL17RC --- forms in response to IL17a binding to IL17Ra and IL17Rc
IL22RC --- forms in response to IL22 binding to IL22Ra1 and IL10Rb
InsRC --- forms in response to Ins binding to InsR
NgfRC --- forms in response to Ngf binding to NgfR
PdgfRC --- forms in response to Pdgf binding to PdgfR
RageC --- forms in response to AGE binding to Rage
Tgfb1RC --- forms in response to Tgfb1 binding to TgfbR1 and TgfbR2
TLR2C --- forms in response to TLR2 ligands binding to TLR2
TLR3C --- forms in response to TLR3 ligands binding to TLR3
TLR4C --- forms in response to TLR4 ligands binding to TLR4
TLR9C --- forms in response to TLR9 ligands binding to TLR9
TnfR1C --- forms in response to Tnf binding to TnfR1
TrkaC --- forms in response to Ngf binding to Trka
VegfR2C --- forms in response to Vegfa binding to VegfR2
Non Receptor Complexes
CHR --- forms around Chromatin
RNAC --- forms around the capped mRNA complex
Modifications
aaBound --- tRNA bound to any amino acid
aaFree --- tRNA not bound to any amino acid
absent --- not present
acetyl --- acetylated
acetyl-site --- acetylated at a specific site
act --- activated (for kinases only)
broken --- for DNA with strand breaks
cleaved --- cleaved
cleaved-site --- cleaved at a specific site
clustered --- for aggregated proteins
degraded --- degraded
dimer --- auto-dimerized
DNAbound --- bound to DNA
GDP --- bound to GDP
GTP --- bound to GTP
K48ubiq --- covalently bound to ubiquitin polymerized via K48 linkages
K63ubiq --- covalently bound to ubiquitin polymerized via K63 linkages
off --- gene transcription is off
oligomer --- auto-oligomerized
on --- gene transcription is on
ox --- oxidized
p17 --- 17 kD fragment
p50 --- 50 kD fragment
pore --- forming a membrane pore
red --- reduced
spliced --- mRNA has been spliced
STphos --- phosphorylated on Serine and/or Threonine
Tphos --- phosphorylated on Serine
Tphos --- phosphorylated on Threonine
ubiq --- ubiquitinated
unk --- unknown
unspliced --- mRNA has not been spliced
Yphos --- phosphorylated on Tyrosine
If the occurrences are in a complex, they are displayed with components stacked in a rounded rectangle. Darker colored ovals represent occurrences in the initial state (the state of all occurrences before a stimulus is added. Lighter colored ovals represent potential states/locations of these components.
Rectangles represent rules. The label in a rectangle is its (abbreviated) identifier in the knowledge base. Solid arrows from an occurrence to a rule indicate that the occurrence is a reactant (rule input). Solid arrows from a rule to an occurrence indicate that the occurrence is a product (rule output). Dashed arrows from an occurrence to a rule indicate that the occurrence is a modifier/enzyme/catalyst—it is necessary for the reaction to take place but is not changed by the reaction.
Browsing the Death Network
Here are some ways to explore the Death network.Find the node representing Cell-Death
- Select the Occurrences Tab in the lower right panel.
- In the text box at the top of the panel type "Cell".
- Click Tab until CELL-DEATH@Sig is highlighted.
- Double click on the highlighted occurrence (or click the "Find" button at the bottom) to center the visible part of the graph on the occurrence of interest. You can also use the scroll bar on the right of the occurrence list to find the occurrence of interest and select it by clicking directly on the item in the list.
There are three ways that cells can die in this network: Pyroptosis, Necroptosis, and Apoptosis. Lets look at Apoptosis.
- Select the Selections Tab in the lower right panel.
- Check the box in the Goal column next to APOPTOSIS@Sig.
- Press the button labeled Subnet in the tool bar.
Shortly a new tab will appear displaying a graph representing a subnet containing all the paths leading to Apoptosis. Simplify the graph by hiding redundant edges.
- Check the Redraw? box in the tool bar.
- Click on the HideEdges button.
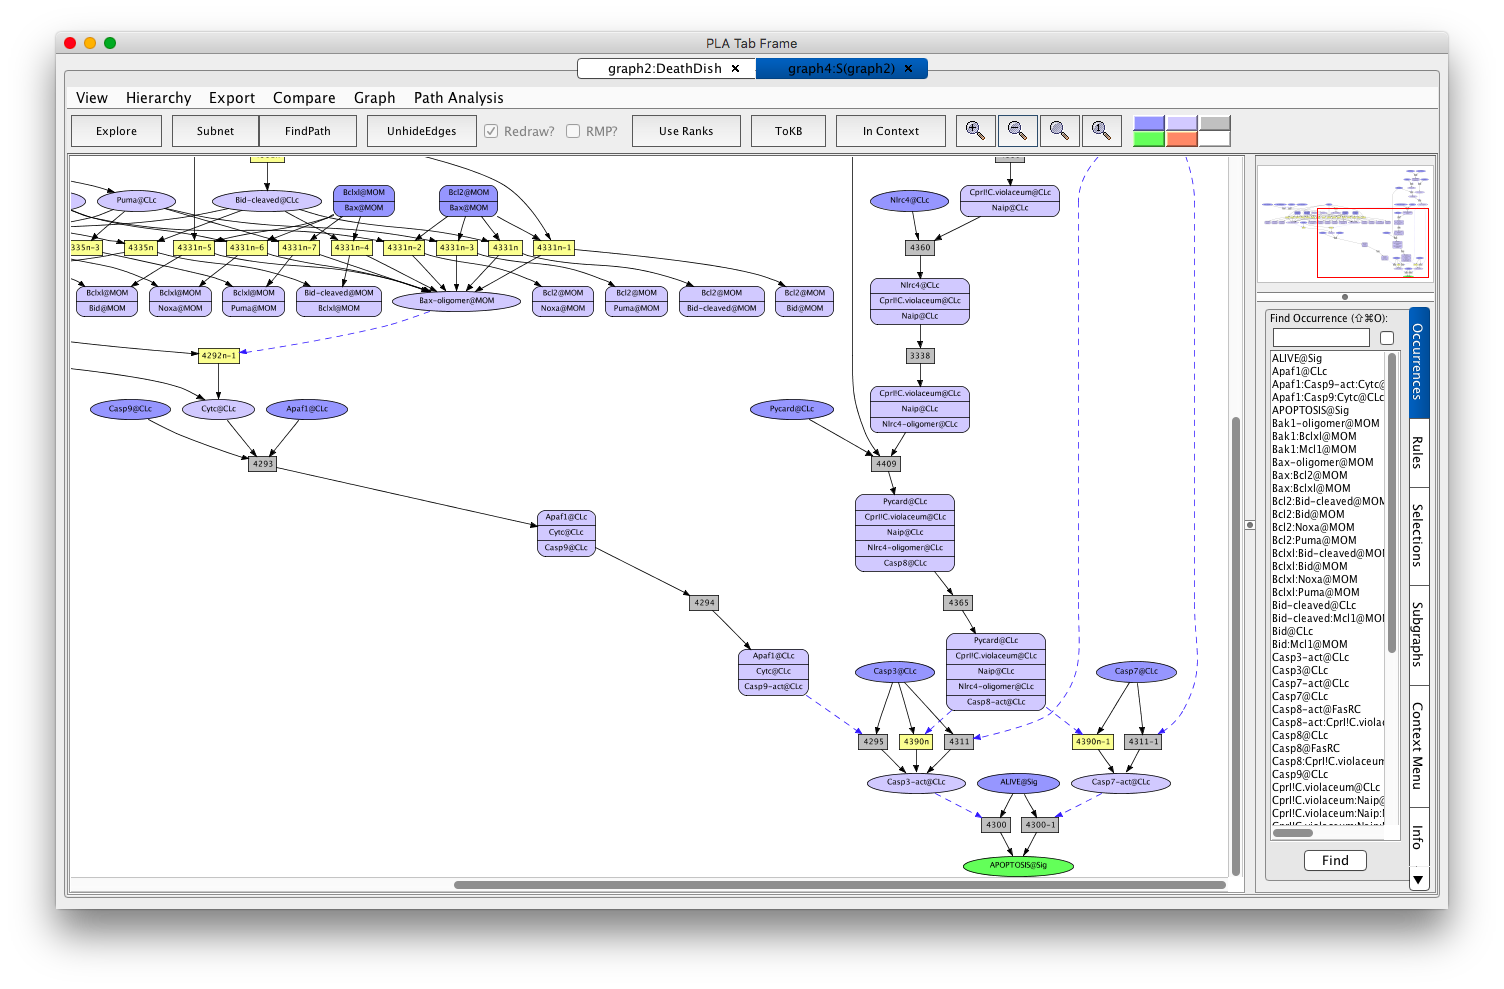
Screen shot of the DeathDish Apoptosis subnetwork
- Click on Path Analysis in the Menu Bar.
- Choose Number of Paths.
The answer will appear in the information panel. (There are 20 paths.)
To look at each of the paths in context of the graph:- Click on Path Analysis in the Menu Bar.
- From the "Paths Using Occurrence" menu select ALIVE@Sig.
All the paths will be listed in the info panel (since they all must turn ALIVE into DEAD). These are shown as lists of rule numbers but each can be highlighted in the graph by clicking on the box in the highlight column.
Suppose you are only looking for paths originating from the needle protein from Chromobacterium violaceum (CprI!C.violaceum).
- Click on Path Analysis in the Menu Bar.
- Choose Custom Path Chooser.
- Click the box next to CprI!C.violaceum@CLc and the OK button.
There are two paths using CprI!C.violaceum@CLc. You can compare the two paths by clicking back and forth or you can compare them directly. For each path launch a new network by pressing the Launch button at the bottom of the panel. You will now have a graph for each path (graph6 and graph8). From graph6 (the first path launched) click on Compare in the menu bar. Choose graph8 (the second path launched) from the list of graphs. A compare graph will appear.
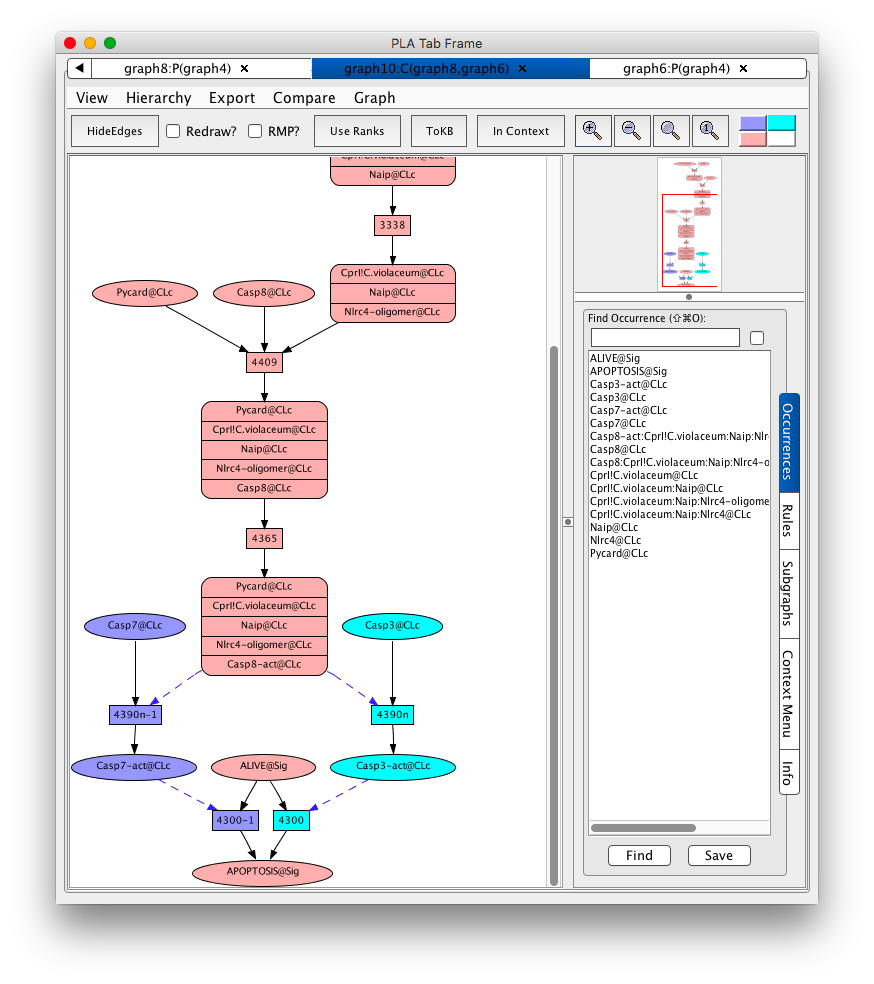
Comparison of paths from CprI!C.violaceum@CLc to Apoptosis
The nodes in pink are common to both graph6 and 8. The nodes in purple are unique to graph16 and the nodes in cyan are unique to graph18. It is now obvious that apoptosis can be caused by activation of either Caspase-3 or Caspase-7.
Entity Identification
We have supplied a table of modifications and locations above but what about the proteins and chemicals. If you are unfamiliar with the name we use for a protein or just want to learn more about it, you can click on the occurrence node. The Context Menu Tab in the information panel (lower right) will display some buttons which include "About Occurrence". Clicking on this button will display relevant information. For proteins, there is a link to the UniProt record. For chemicals, there is a link to the PubChem CID.
Evidence
All of the rules in the response networks are derived from experimental data so if you are doubtful or curious about a rule, you can ask for the evidence page and see the data that was used to create the rule. You can see an example by looking at the evidence page for rule 1546 which was imported from the Lps Response network.
- Select the Rules Tab in the lower right panel.
- In the text box at the top of the panel type "1546".
- Double-click on the highlighted rule. It will be centered in the Graph Panel.
- Click on the rule node.
- Click on the Rule Evidence button in the Info Panel.
- Click on the link to the Datum file.
A page containing all the datums used to create the rule will display.
Not sure how to read a datum? You can find details in the Datum KB documentation .In the Death Story, rules were created from assertions made in review articles. Evidence pages for these rules contain the assertions, their sources, and references provided. If the assertions had references containing experiemntal results, they were collected as datums. If the datums supported the assertions, they were added to the evidence pages. Rules without significant experimental evidence are colored yellow.
- Select the Rules Tab in the lower right panel.
- In the text box at the top of the panel type "4299n".
- Double-click on the highlighted rule. It will be centered in the Graph Panel.
- Click on the rule node.
- Click on the Rule Evidence button in the Info Panel.
- Click on the link to the Datum file.
Conclusion
That should get you started. Please look at some of the response networks. (Go back to the STM8 launcher, select a response network and press the launch button.) In the case of the very large nets, when you select the dish the PLA window displays the list of occurrences rather than the graph. This is because the graph is complex, looking rather like a dish of spaghetti and may just confuse (or frighten). If you really want to see the graph, press the Render button. It may take a couple minutes, so have patience. If you know the goal you are interested in, you can skip rendering the full graph and use the selections tab to set the goal and compute the relevant subnet. If you are interested in the rules that change or use a particular occurrence, you can use the PLA Explore mechanism to display the surrounding network, restrict exploration to upstream or downstream events.
The curation of STM8 was partially supported by funding from NIH, NSF, DARPA, and IARPA.