Guided Tour of the Pathway Logic Model: STM6
STM6 (STM for stimulus, 6th version) is a formal knowledge base containing information about the changes that occur in the proteins inside a cell in response to ligands binding to receptors on the cell surface. Ultimately, we intend to link these responses to changes in gene expression and cellular morphological phenotypes such as induction of proliferation and differentiation. So far we have been able to produce hypothetical pathways leading to the activation of a few transcription factors and epigenetic regulators. PLA provides a graphical representation of the STM6 reaction network and the ability to browse and analyze this network.
The STM6 model contains 10 dishes, 9 ligand specific dishes and one 'no ligand' dish. Each ligand specific dish describes an initial state which corresponds to the state of the cells in a culture dish at the start of an experiment, plus a ligand. The base initial state in each of these 9 dishes is the same--the cells are adherent and quiescent. Each dish is obtained by adding to the base state one ligand and it's associated receptor(s). The currently available ligands are: Cd40lg, Csf1, Egf, Igf1, IL1, Ins, Tgfb1, Tnf, and Lps. The 'no ligand' dish has all of the receptors for the 9 ligands, but as the name suggests, no ligands. Effects caused by more than one ligand can be viewed by creating a new dish using the edit command in the "Select Dish" menu. The 'no ligand' dish is a convenient starting point (in the dish editor, ask Maude). An example of dish construction is provided in the SmallKB guide . The network displayed by PLA for a given dish is the network of reactions that have been shown to occur in response to the stimulus.
The experimental evidence for each rule is supplied in datum form. Each datum represents a result from a experiment published in a refereed journal. In some cases, the evidence is weak or incomplete or simply based on correlations. Some attempt has been made to point out the weak spots but the bulk of the effort has gone into collecting and presenting the data in such a way that the biologist can decide for himself. Datums are written in a shorthand designed to be both readable by biologists and parsible by a computer. A manual containing the abbreviations and conventions used by the shorthand can be found in the curation notebook . Information about unfamiliar protein names can be found by clicking on the protein representation in the PLA viewer. (Independent access to this information is work in progress.)
The purpose of Pathway Logic models such as STM6 is to:
- help biologists keep track of published experimental results
- assist in hypothesis making
- arrange (and rearrange) the curated data into conclusions (graphically)
- locate holes in experimental evidence things that have been accepted as truth for so long that they have become the truth without any evidence
- by integrating pathway components into a common framework one can see connections between proteins in various "pathways" not discussed in the experimental or review literature (Abl/Plscr1/Egf??)
- provide accurate maps suitable for computational analysis
This demo assumes that the user is already familiar with the use of PLA as described in the SmallKB guide and the PLA reference manual .
In this guided tour, double click on a figure to see an enlarged version. Single click to restore the figure to its original size.
Guided Tour: Revisiting the Egf Pathway using PLA and the STM6 KB.
Introduction
In this guided tour we focus on response to Egf stimulation. This version of the Egf Network looks different from others because it is based on experimental data only. An Egf rule is derived from changes observed in response to Egf binding to the EgfR. If assumptions about protein interactions based on over-expression or test-tube reactions or similarity with other tyrosine kinase receptors are used, notes are included in the evidence files. The change in state of the components of the pathway are recorded as Pathway Logic rules which are then assembled into Petri net format by PLA. The resulting graph is loaded into PLA for viewing and analysis. A link to the evidence supporting each rule is provided in the viewer. Once a Petri net is assembled, PLA can be used to find Paths through the network to a chosen goal. The path we are going to discuss in this demo is the path between Egf binding to the EgfR and activation of Erk1 and Erk2 (abstracted as Erks as most of the existing evidence does not distinguish between these two members of the family). This path is traditionally considered to be:
References:
- Biocarta
- The Cancer Cell Map at Memorial Sloan-Kettering Cancer Center.
- Kegg
- Reactome
The STM6 Demo
If you haven't already started the STM6 online demo, you can do so by clicking here and following the instructions.
When PLA starts up, a knowledge base manager window (title: PLA KBManager) appears in the upper left corner of your screen. The KBManager displays a list of available knowledge bases (rule sets). "RKB" is selected by default and will be highlighted in blue.
Start by selecting a predefined dish: press the "Select Dish" button on the right side of the KBManager window. This produces a menu with two options: "Edit" and "PreDefined". Select (click on) "PreDefined". This produces a (sub)menu with a list of pre-defined dishes. Select "EgfDish" (by clicking on the corresponding menu item).
Shortly a PLA viewer window (titled InitialNet for EgfDish (graph2)) will appear on your screen displaying the Egf Network (the network of reactions reachable starting from the occurrences in EgfDish). [Note that the graph numbers in titles may differ if you have created graphs or nets in addition to those discussed in the demo. This is fine.]
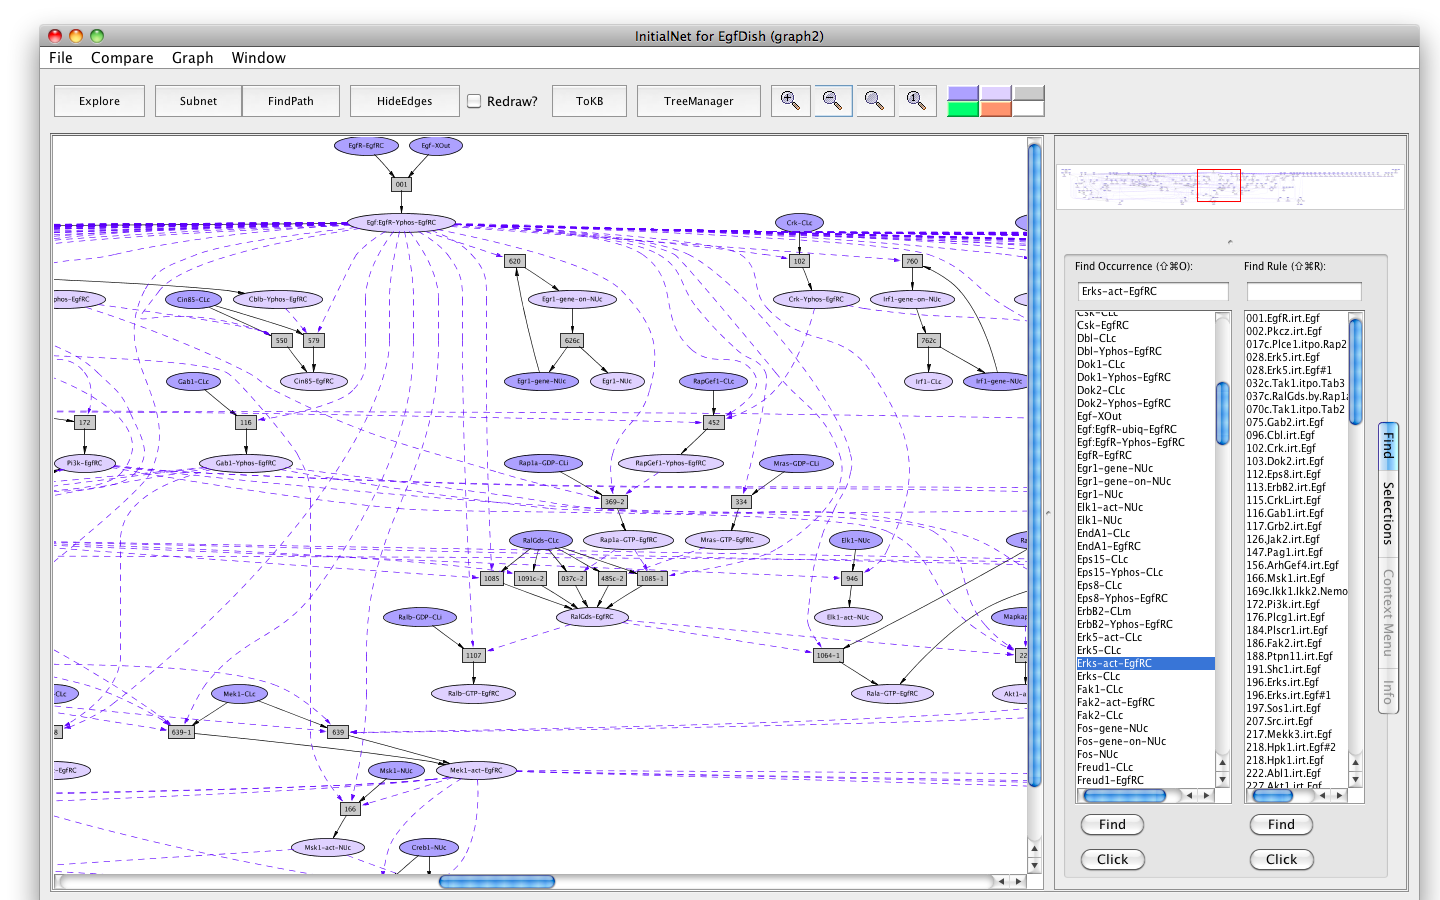
Screen shot of the Egf dish graph
Locations

  XOut --- outside the cell, the medium or supernatant
  CLm --- in/across the cell membrane
  CLi --- attached to the inside of the cell membrane
  CLc --- in the cytoplasm
  EgfRC --- in the EgfR complex
  NUc --- in the nucleus
  Sig --- nowhere, used as a location for degraded proteins
Modifications

 phos  --- phosphorylated
 phos-site --- phosphorylated at site
 Yphos --- phosphorylated on a tyrosine
 act   --- activated
 reloc --- relocated
 ubiq  --- ubiquitinated
 GDP   --- loaded with Guanosine diphosphate (GDP)
 GTP   --- loaded with Guanosine triphosphate (GTP)
 degraded --- degraded
Darker colored ovals represent occurrences in the initial state (the selected dish when the network is generated by choosing a dish). Lighter colored ovals represent potential states/locations of these components.
Rectangles represent rules. The label in a rectangle is its (abbreviated) identifier in the knowledge base. Solid arrows from an occurrence to a rule indicate that the occurrence is a reactant (rule input). Solid arrows from a rule to an occurrence indicate that the occurrence is a product (rule output). Dashed arrows from an occurrence to a rule indicate that the occurrence is a modifier/enzyme/catalyst—it is necessary for the reaction to take place but is not changed by the reaction.
Subnets and Pathnets
The network shown in the InitialNet (graph2) includes all the reactions that fire in response to Egf. Suppose we are only interested in those reactions leading to the activation of Erks. This is accomplished by finding the occurrence that contains activated Erks, marking it as a goal, and asking for the relevant subnet:
- Type Erks in the Find Occurrence window
- Press on the Tab key until "Erks-act-EgfRC" is highlighted in the list below.
- Click on the Click button. This will locate and highlight the requested occurrence node in the main view window and open the context window (lower right).
- Click on the Set Goals button in the context window. The node will turn green.
- Press the button labeled Subnet in the tool bar. Shortly a new window will appear displaying a graph representing a subnet containing all the paths leading to activation of the Erks. (Subnet of EgfDish (graph4)).
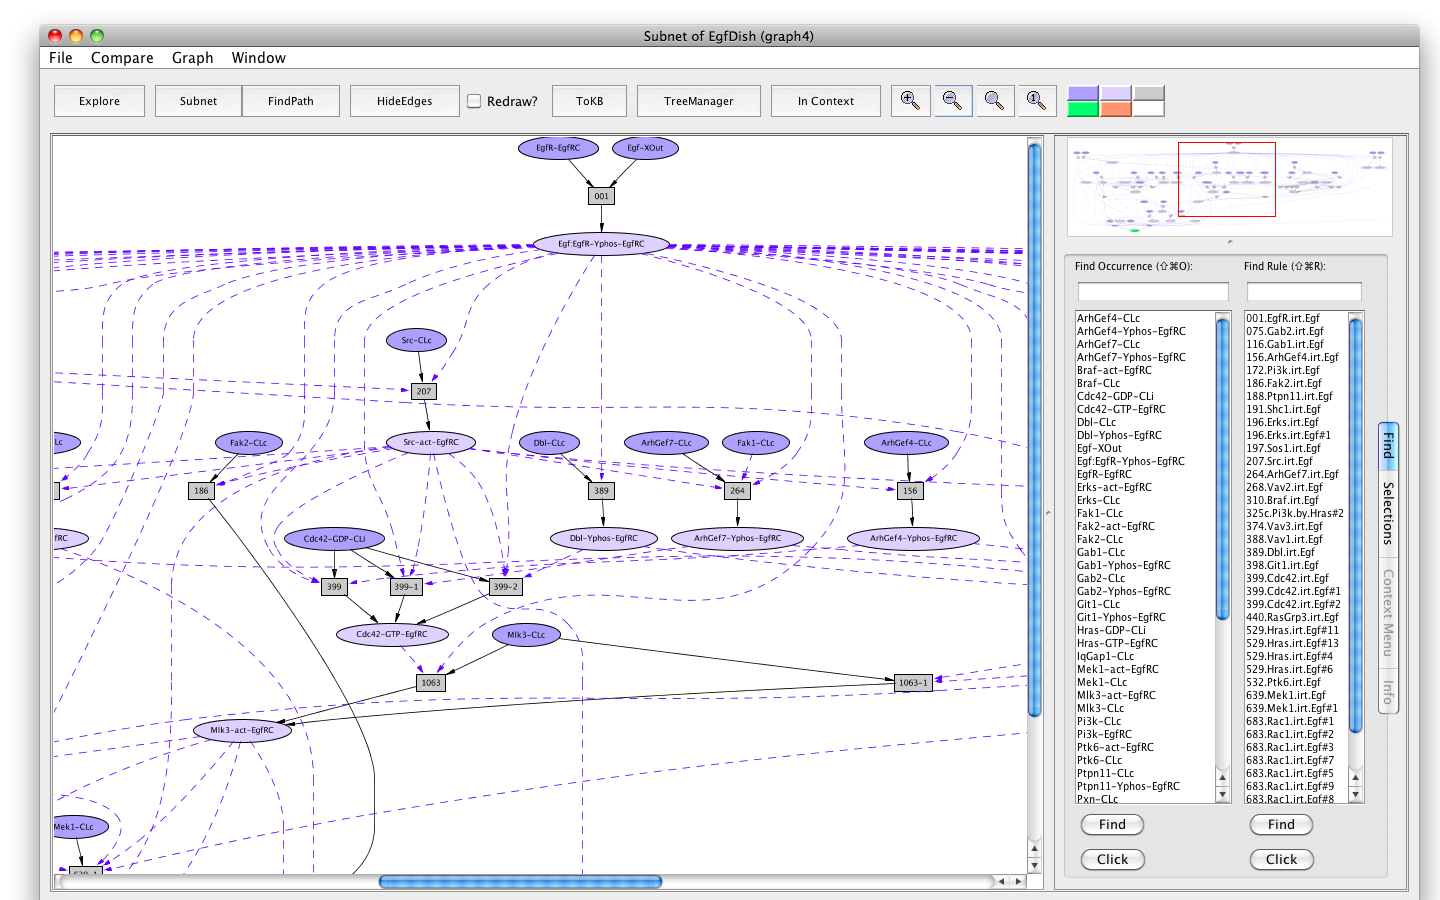
Screen shot of the subnet relevant to activation of Erks
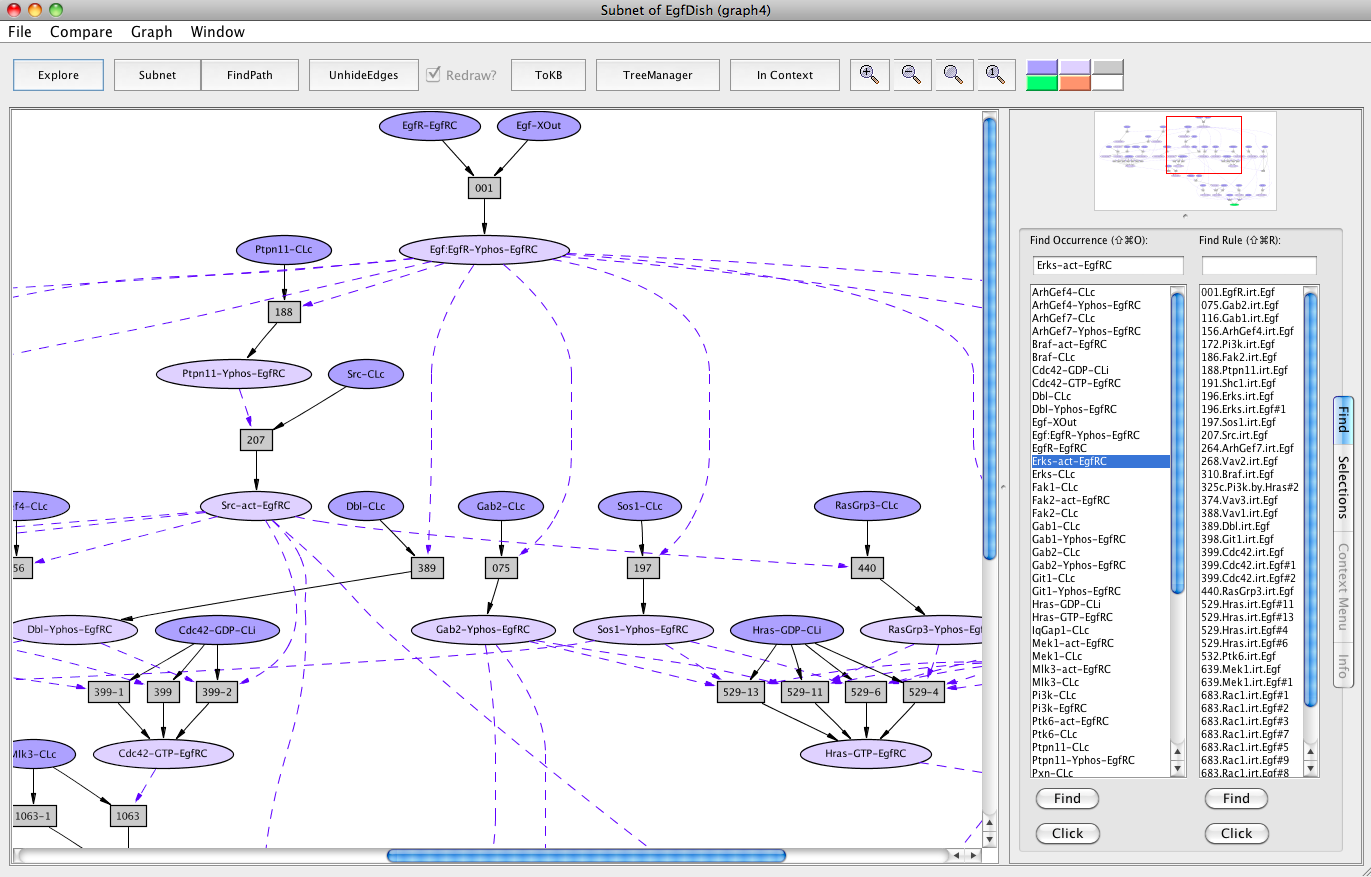
Screen shot of the subnet relevant to activation of Erks with redundant edges hidden
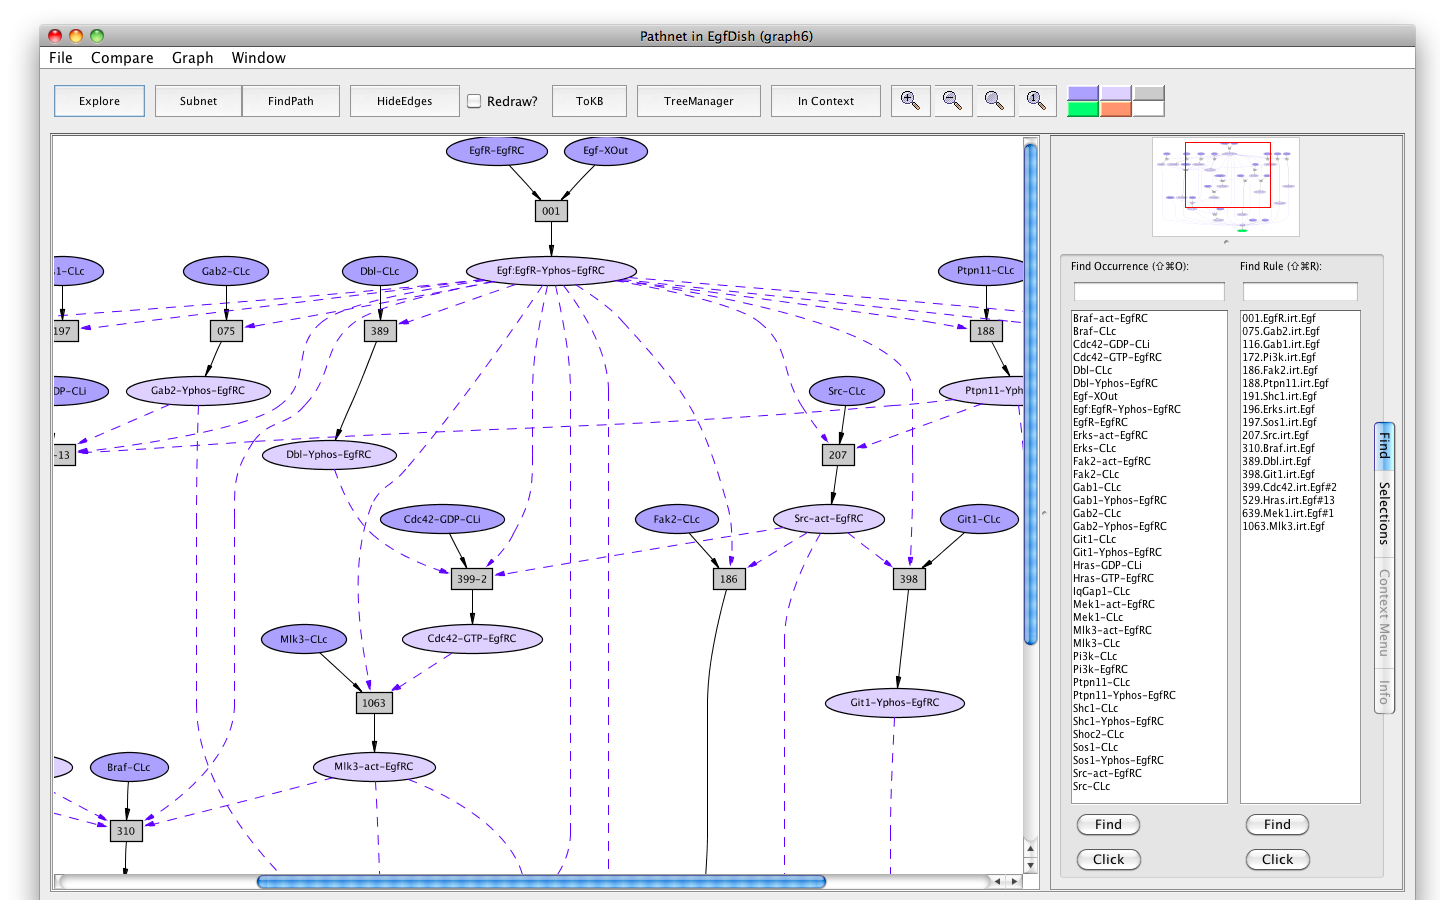
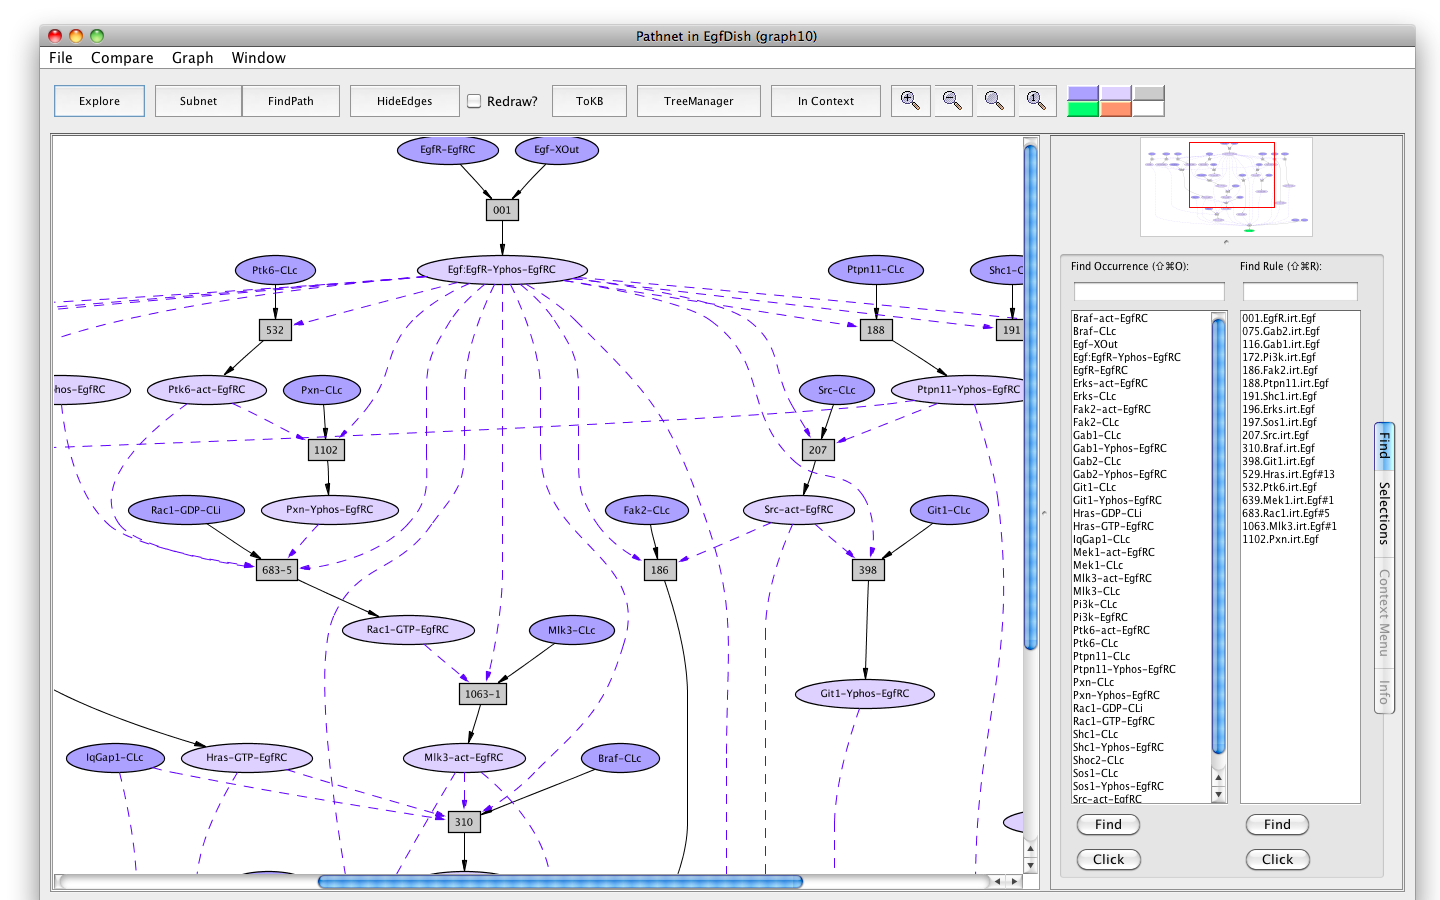
Screen shot of a pathway activating of Erks
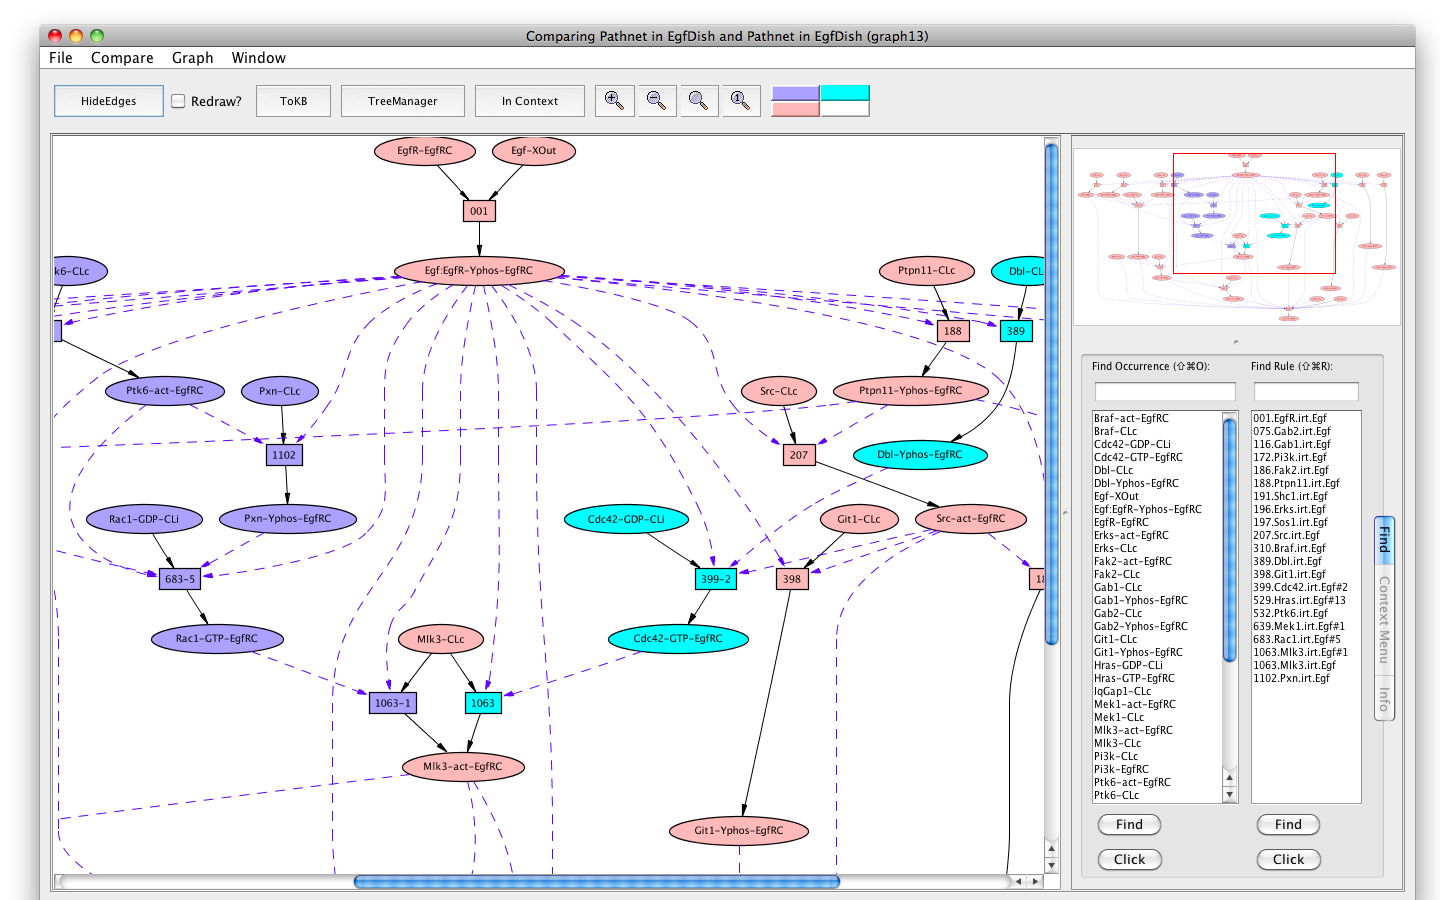
If the Pathnet in graph6 is compared to the Subnet in graph4 (choose Subnet of EgfDish (graph4) from the Compare menu), alternative nodes will be highlighted in teal.
The Erks pathway in the context of the subnet (edges hidden)
A subnet using Rac1 instead of Cdc42 can be generated by returning to the first EgfDish subnet (Subnet of EgfDish (graph4)), marking Cdc42-GDP-CLi as an avoid and pressing the FindPath button again.
Screen shot of a pathway activating Erks avoiding Cdc42
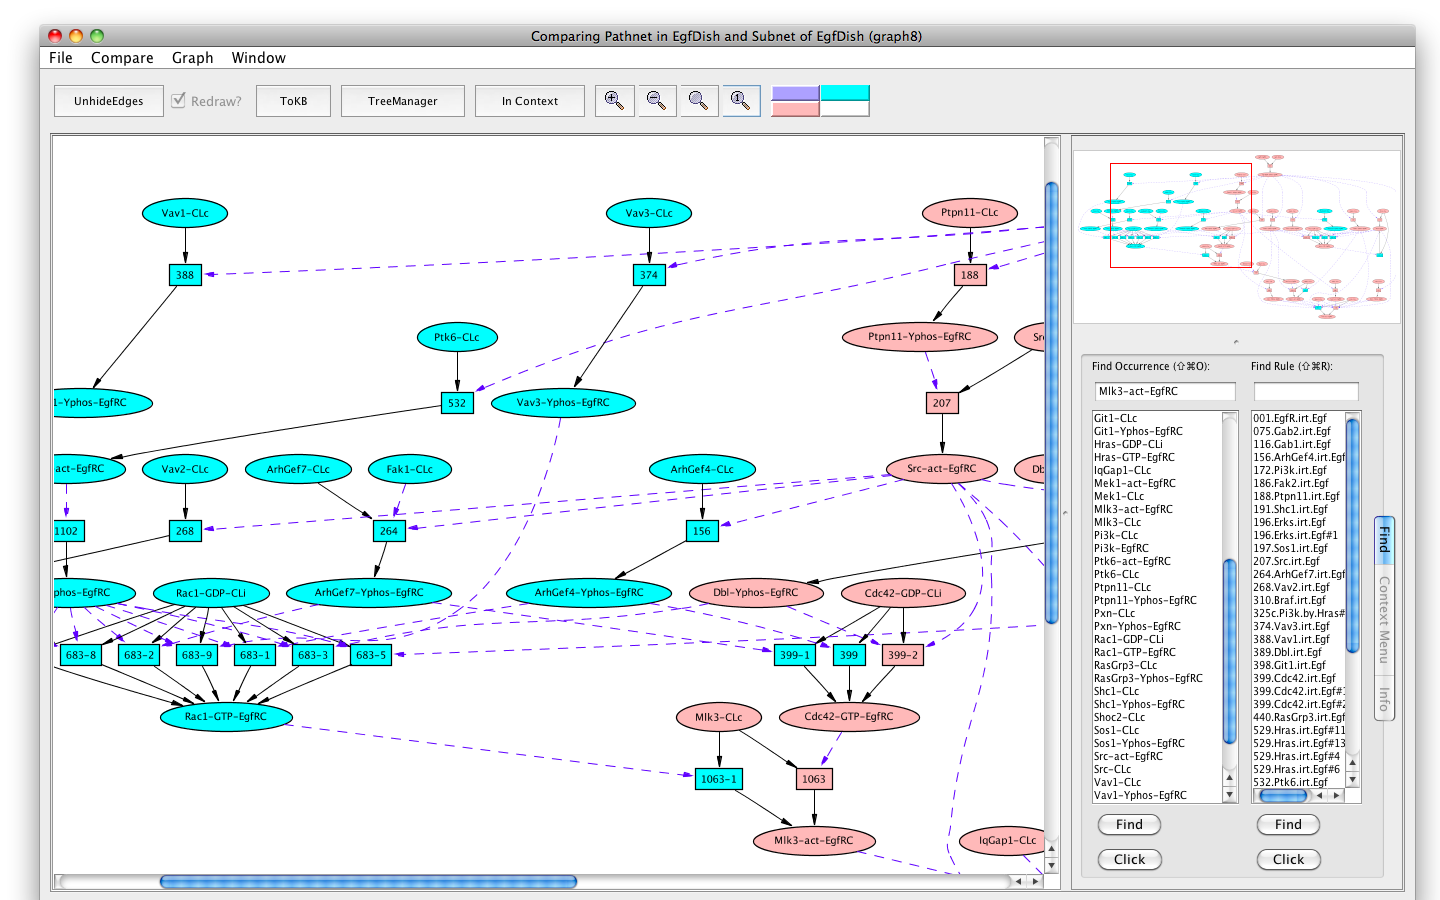
You can compare the two pathways by selecting the "Compare" menu from the menu bar, and selecting the original pathnet (the only one available). The pink shows the shared elements of the pathways, while the blue and teal indicate elements unique to the different pathways.
Comparing pathways activating Erks using and avoiding Cdc42
Rules
The little gray rectangular nodes represent rules. A rule describes the transition of the state of the proteins in a cell to another state. Only the proteins involved in the transition are mentioned in the rule. Consider rule 196 at the bottom of the Pathnet (graph6). (You can see this rule in its own window by clicking on the rule node and then clicking on the "exploreRule" button in the resulting information window. The rule is now displayed in an explorer window and the node colors indicate whether there are any connections in the parent network. Place the mouse over the color key in the upper right for details.) The rule says that if the following occurrences are present:Braf-act-EgfRC, Fak2-act-EgfRC, Gab1-Yphos-EgfRC, Git1-Yphos-EgfRC, Hras-GTP-EgfRC, Mek1-act-EgfRC, Mlk3-act-EgfRC, Pi3k-EgfRC, Ptpn11-Yphos-EgfRC, Shc1-Yphos-EgfRC, IqGap1-CLc, Shoc2-CLc, and Erks-CLcthen the Erks will be recruited into the EgfR complex and become activated.
Evidence.
Where did all those bizarre requirements come from? Clicking on the rule node will open the information window. Clicking on the Show Evidence button will call up a document containing the experimental evidence that supports (or not) the rule.The evidence page is written in datum shorthand and will look at first to be uninterpretable. Instructions on how to read the evidence can be found in the curation notebook. For those who find it easier to read each reference and dig out the evidence for themselves, we have provided the PubMed ids and the Figure/Table numbers of the relevant experiments.
Discussion of rule 196.
The evidence page for rule 196 reports on 237 experiments in which Erk1, Erk2, or both were either phosphorylated on their TEY site (T202/Y204 for Erk1, T185/Y187 for Erk2) or activated in an in vitro kinase assay. The peak response occurred around 5-10 min. Forty-nine different cell lines or primaries were represented.Things that are required
The requirements listed above for the activation of Erks in response to Egf (rule 196) are determined by performing the stimulation in cells lacking proteins due to knock-out at the gene level [KO], knock-down by RNA interference [RNAi], mutation at the gene level [substitution], or expression of a dominant-negative mutant [addition]. Some of the required proteins such as Mek1, Hras, and Shc1 are familiar and mentioned in most of the published Egf Pathway diagrams. Surprisingly, although Raf1 is activated in response to Egf, there is plentiful evidence that Raf1 is NOT required for Erk phosphorylation or activation in response to Egf Surprisingly, although Raf1 is activated in response to Egf, there is plentiful evidence that Raf1 is NOT required for Erk phosphorylation or activation in response to Egf [11296227, 11296228, 12048245, 17314031, 15258589] References [17314031, 11296228] also show that Mek1/2 activation in response to Egf does not require Raf1.So what activates Mek1? Other kinases capable of phosphorylating Meks at the SMANS site (S218/S222 for Mek1, S222,S226 for Mek2) are Braf [17314031], Araf [8621729], Pak2 or Pak3 [17314031], and Mlk3 [12738796].
Could Araf substitute for Raf1? Evidence that Araf is activated in response to Egf is equivocal (click here) and although Araf has been shown to be capable of increasing the kinase of activity of Mek1 in a cell-free system no experiments have be found testing the requirement of Araf for either Mek1-phos/act or Erks-phos/act in response to Egf.
Activated Pak1, Pak2, and Pak3 can phosphorylate Mek1 directly on S298 which leads to Mek1 autophosphorylation on (S218/S222) [17314031 Fig-4a].
Although Pak1 has been shown to be activated in response to Egf, phosphorylation of Meks and Erks at their activation sites in response to Egf was not affected by RNAi to Pak1 and Pak2 [16129686-Fig-3a]. In addition, there are reports that Erks are not activated when cotransfected with active Pak1 [8805275 Fig-5a, 9351825 Fig-6b, 16698790 Fig-6b]. Pak3 can be excluded because it is not activated irt Egf [11259591-Fig-5a].
Although Mlk3 can phosphorylate Mek1 directly [12738796] on an unknown site, its requirement by Braf and Erks does not require its kinase activity [16537381].
Furthermore, over-expression of Mlk3 actually inhibits the activation of Erks in response to Egf [12738796].
This is indicative of a scaffold or adaptor protein rather than a active member of a phosphorylation cascade. Mlk3 is required for activation of Braf [16537381], Mek1 [15258589] and Erks[15258589, 16537381] in response to Egf.
It is unfortunate that the papers that demonstrated that Braf was required for Erk phosphorylation [15199148, 15258589] did not perform one additional experiment to show that Braf is required for Mek1 activation in response to Egf. One of the objectives of Pathway Logic is to make it easier to discover such omissions.
Src and Fak2 are recruited to the EgfR complex and phosphorylated in response to Egf so it is logical to wonder if they are part of the path that activates Erks. Erk activation is only partially inhibited by expression of dominant-negative Src and Fak2. A partial inhibition suggests that there may be something that substitutes for the proteins. That idea is supported by the information that activation of Src in response to Egf requires Rala [10675331] but Erk phosphorylation does not require either Rala [10675331] or RalGds [11283245, 18285454].
The locations
The interactions of some of the required proteins such as Fak2, Shc1, Sos1, Src, and Git1 with phosphorylated EgfR have been extensively studied so that we have information about their change in location and modifications in response to Egf. Others such as Shoc2 and IqGap1 are recent findings and more curation (or experimentation) is needed to determine location and modifications. These proteins have been placed in the cytoplasm without modifications until more information is available. Interestingly we have been unable to find any experiments in which Hras, Braf, Mek1, or Erks have been shown to coprecipitate (or not) with EgfR after Egf stimulation. Thus the accumulation of these proteins into the EgfR complex are merely a supposition of the curator. The lack of evidence for the location is duly noted at the top of each evidence file.Things that are missing
Those familiar with the canonical Egf pathway will notice immediately that Grb2 is not represented in the Pathnet from Egf to Erks. This is due to lack of direct evidence. We have evidence that the amount of Grb2 and Sos1 that coprecipitate with EgfR increases significantly in response to Egf although the coprecipitation of Grb2 with Sos1 changes very little (click here and here). But we do not have evidence that Grb2 is required for any of the downstream events. So, until we have evidence, Grb2 gets left out.Another noticeable discrepancy is that Mek2 is not mentioned. Out of 43 experiments in which changes to Meks in response to Egf are recorded, only one of them looks at Mek2 specifically. In the cases where an anti-phospho-Mek antibody was used, the antibody was reported to be specific for only phospho-Mek1 or for both phospho-Mek1 and Mek2. There were no experiments that used an antibody specific for phospho-Mek2. Therefore, only Mek1 is represented in this pathnet.
Conclusions
The network presented here is not intended to be cast in stone. It is a set of hypotheses derived from the curated data that provide a logical explanation of how a signal propagates in response to an Egf stimulus.This demo provides an illustration of:
- How PLA can be used to help interpret experimental results.
- The ease with which pathways can be assembled, drawn, and navigated.
- How collecting experimental results in the form of datums can aid reasoning and discussion.
- How gaps in experimental knowledge can be discovered in the process of formulating and checking the hypotheses.