Guided Tour of the Pathway Logic SmallKB
In Pathway Logic (PL) steps of a signal transduction pathway/process are represented as transition rules that change the state and or location of signaling proteins. A protein (or other biomolecule) together with its state and location is called an occurrence (also called a species in some modeling systems). Rather than model predefined pathways, transition rules, representing biochemical reactions/transformations, are curated from the literature and collected into a knowledge base (KB). In the context of such a KB, a model is specified by specifying the set of occurrences initially present (called an initial state or dish, as in petri dish). See PL basics for more details about the PL representation system.
The PLA viewer allows you to browse and query networks derived from an initial knowledge base. SmallKB is a small part of a model of the response to Egf stimulation in epithelial-like cells. It includes sufficiently many reactions to illustrate many features of signaling networks while being small enough to allow the user to quickly try the different features of PLA. See the PLA reference guide for a more complete description of PLA features.
In this guided tour, double click on a figure to see an enlarged version. Single click to restore the figure to its original size.
CONTENTS
Startup
  Navigating a Network Graph.
  Getting information graph nodes
Finding pathways
  Activating Hras
  Activating Plcg
  Comparing Pathways
Making your own model
Exploring a network
Startup
When PLA starts up, a knowledge base manager window (title: PLA KBManager) appears in the upper left corner of your screen. The KBManager displays a list of available knowledge bases (rule sets). Initially, in this demo, there is just one KB, SmallKB. The currently selected KB highlighted in blue.
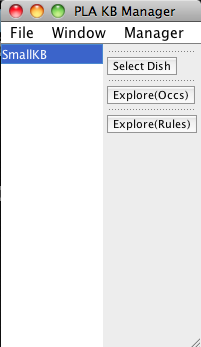
Screen shot of the PLA KBManager
Start by selecting a predefined dish: press the "Select Dish" button on the right side of the KBManager window. This produces a menu with two options: "Edit" and "PreDefined". Select (click on) "PreDefined". This produces a (sub)menu with a list of pre-defined dishes (in this case "rafUbe213Dish" and "rasDish"). Select "rasDish" (by clicking on the corresponding menu item). Shortly a PLA viewer window (titled InitialNet for rasDish (graph2)) will appear on your screen displaying the rasDish model (the network of reactions reachable starting from the occurrences in rasDish).
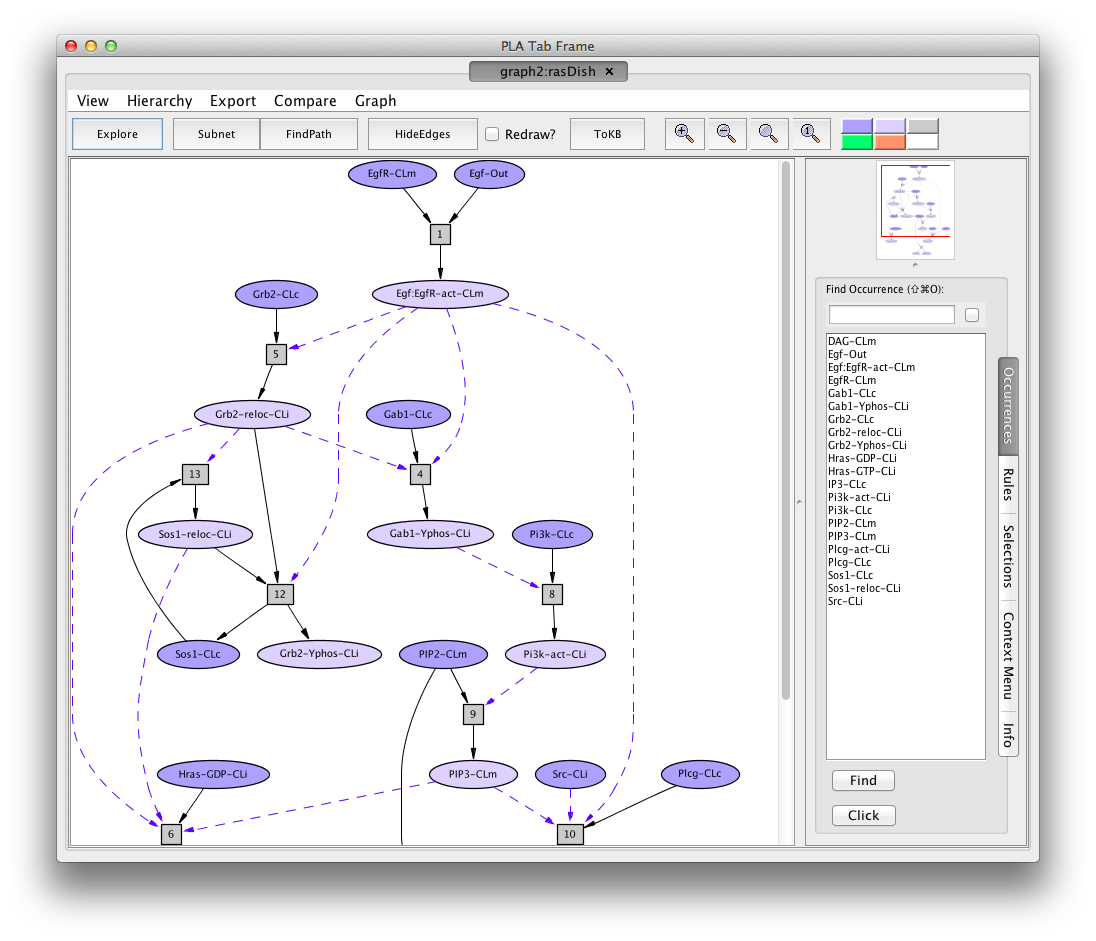
Screen shot of the Hras dish graph
A network of reactions is displayed as a graph with two kinds of node. Ovals represent occurrences---proteins or chemicals in a specific state and location. For example the oval labelled Egf:EgfR-act-CLm represents an Efg receptor (also known as ErBb1) that is bound to its ligand, Egf (Egf:), activated (-act) and located in the cell membrane (-CLm).
We use the following abbreviations.
Locations
  Out --- outside the cell, the medium or supernatant
  CLm --- in/across the cell membrane
  CLi --- attached to the inside of the cell membrane
  CLc --- in the cytoplasm

Modifications
 Yphos --- phosphorylated on a tyrosine
 act   --- activated
 reloc --- relocated
 ubiq  --- ubiquitinated
 GDP   --- loaded with Guanosine diphosphate (GDP)
 GTP   --- loaded with Guanosine triphosphate (GTP)
Darker colored ovals represent occurrences in the initial state (the selected dish when the network is generated by choosing a dish). Lighter colored ovals represent potential states/locations of these components.
Rectangles represent rules. The label in a rectangle is its (abbreviated) identifier in the knowledge base. Solid arrows from an occurrence to a rule indicate that the occurrence is a reactant (rule input). Solid arrows from a rule to an occurrence indicate that the occurrence is a product (rule output). Dashed arrows from an occurrence to a rule indicate that the occurrence is a modifier/enzyme/catalyst---it is necessary for the reaction to take place but is not changed by the reaction.
Navigating a Network Graph.
In the upper right of the PLA graph window is a thumbnail sketch of the full graph with a red rectangle delineating the part of the graph visible in the graph panel (on the left). Drag the rectangle around or click on different points in the thumbnail to change what is visible in the graph panel.
In the lower right of the PLA graph window is an information pane with several tabs. The "Find" tab (the default) contains two lists: on the left a list of all occurrence nodes in the graph, and on the right a list of all rule nodes. You can use these lists to find a node of interest and center the view on that node.
For example, type "hr
Some of the arrows lead to nodes not visible in the current view. To find out what is at the other end, click on the arrow. To go to the other end, double-click on the arrow. For example, click on the middle dashed arrow leading into rule 6. The information window (context tab) tells you what the node at the other end is, and also provides some options for re-centering the graph. Click on the button labelled Goto Grb2-reloc-CLi (off screen). Now the graph view is centered on the other end of the arrow (Grb2-reloc-CLi). Double clicking on the arrow (middle dashed arrow coming out of Grb2-reloc-CLi) and the view will be recentered on the arrows other end.
Getting Information About Graph Nodes.
Clicking on a node displays information options in the Context tab of the information pane.
-
Click on the oval labelled Hras-GTP-CLi.
The information panel (on the right)
presents options for finding out about this occurrence. The button labelled
Show info displays information for debugging.
- Click on the button labelled About Occurrence. Now the panel displays information about Hras: its HUGO name, its SwissProt name, links to the SwissProt and PFAM web pages and some synonyms.
- Click on the SwissProt link. A browser window with the requested page will appear. (You can close the browser window when you are done looking at the page, or keep it around. Its independent of PLA.)
-
Click on rule 6 (the rectangle labeled "6"). The information panel presents
options for finding out about rule 6 (full name 6.Hras.act.1). The button
labelled Show info displays information for debugging; the button
labelled Show Maude Rule displays the rewrite rule corresponding to the
biochemical reaction in Maude syntax.
- Click on the button labelled Show Evidence. You will find a pubmed link to a paper used in curating rule 6. SmallKB is a toy model and the evidence provided is minimal. Highly curated models have evidence pages citing many experimental results.
Finding Pathways
Enough browsing! Lets find some Pathways. A pathway is a collection of rules assembled in response to a query. A query specifies goals---occurrences that should be present, i.e. states and locations of proteins. It may also specify occurences or rules to be avoided. The execution of a pathway (see #Petri nets) leads from the model's initial state to a state satisfying the goals, while not passing through any states containing occurrences to be avoided, or using any rules to be avoided. For the tour we will find two pathways, one activating "Hras" and one activating "Plcg" and compare them.
Activating Hras
First, find a path activating Hras (going from Hras loaded with GDP to Hras loaded with GTP).
- Make sure Hras is visible (use the find list or drag the red rectangle on the thumbnail image)
- Click on the occurrence labelled Hras-GTP-CLi.
- Click on the goal button in the information panel. The node will turn green.
- Press the button labelled FindPath in the tool bar. Shortly a new window will appear displaying a graph representing a pathway leading to activation of Hras. You can do all the things in this window that you could do in the rasDish window (although some are less interesting).
- You will see a new button in the tool bar labelled In Context. Press this button and you will see the pathway in the context of the original graph (context nodes not in the pathway are white). The button is now dark and labelled DOT layout. Press again to get back to the original rendering.
Activating Plcg
Next find a pathway activating Plcg.
- Use the window menu to get back to the rasDish window. Click on the menu labelled Window. At the bottom you will see the windows created so far organized in a hierarchy. For example the window titled "InitialNet for rasDish graph (graph 2)" is the parent of the the window titled "Pathnet in rasDish (graph 4)", and the KBManager window is the top level of the hierarchy. Select "InitialNet for rasDish (graph 2)" and this window comes to the front.
- Reset the goal selection: either click the Set goals button for Hras-GTP-CLi if it is still visible, or select the "Selections tab" (on the right of the information panel) and click the button labelled Reset All Selections at the bottom.
- Now make Plcg-act-CLi a goal. You can do this in the same way that you did for Hras-GTP-CLi, or in the Selections tab with the Set Goals option, click on All to display the list of occurrences. Find Plcg-act-CLi in the list and check its box.
- Press FindPath in the tool bar.
Comparing Pathways
Now we can compare the Hras and Plcg pathways. In the new pathway window (title: Pathnet in rasDish (graph 6), subtitle Goals: Plcg-act-CLi) click on the menu labelled Compare. The window hierarchy will be displayed (gray names are not comparable graphs). Choose Pathnet in rasDish (graph 4). A new graph viewer window will appear displaying the comparison graph. Nodes that belong to both graphs are colored pink, those only in the starting graph (the pathway to Plcg-act-CLi) are colored purple, and those only in the compare to graph are colored cyan. (You can get this information from the color key at the right of the tool bar by mousing over the color of interest.) You can see the comparison graph in the context of the common parent (the rasDish net) by clicking on the In Context button.
Making Your own Dish.
Now try making your own dish (with a little help). We are going to do this using the dish editor, starting with the pre-defined rasDish and adding some occurrences, namely Ube213-ubiq-CLi, Cbl-CLc. This will add a new branch to the rasDish network
- Using the Window menu bring the KBManager window to the front.
- Click on Select Dish and choose the Edit item. A dish editor dialog will appear. There are two panels: the Dish panel on the left contains the occurrences currently in the dish (initially empty) and the Scope panel on the right are the remaining occurrences to choose from.
- Load the predefined dish, rasDish: click on the Dish menu in the upper left, select Ask Maude and then rasDish (say the first copy).
- In the Scope panel click on U to open the U sublist and select Ube213-ubiq-CLi (click on it and a check will appear). In the C sublist select Cbl-CLc. Now press the Add button at the bottom of the Scope panel. The selected occurrences move from Scope to Dish.
- Press the OK button at the bottom right. An Ask User dialog will appear, asking for a dish name. Type in a name (no space or non printing characters please), for example myDish, followed by a carriage return. A new window displaying the graph of the dish network will appear.
Using the compare button or menu compare the graph for myDish to the rasDish graph (graph 2). Try navigating, finding paths, and comparing in the myDish model.
To make the raf1Ube312Dish you need to add PP2a-CLc, Pak1-CLc, 1433x1-CLc, and Raf1-CLc to myDish. This will extend the Hras pathway to activation of Raf1 Try it.
CAVEAT about DISH EDITING!!
PLA assumes that a component (protein or chemical) appears at most once in a dish -- independent of its modifications, binding to other components in a complex, or location. The current version of the PLA dish editor does not enforce this (its on the TODO list). So the user needs use self-restraint and not have more than one occurrence of a component in the dish when the OK button is pressed. For example a dish with both Efg-Out and Egf:EgfR-act-CLm is not allowed.
Exploring a Network.
Another mode of using PLA is to incrementally explore a network starting from an initial set of nodes. Exploration can be initiated from a knowledge base (select one in the KBManager window), or from a network derived from an initial state. The initial nodes for exploration can be specified by choosing a set of occurrences (using the Explore(occs) button) or by choosing a set of rules (using the Explore(rules) button).
Lets explore in the network for the rafUbe213Dish starting from Sos1-CLc.
- Bring the KBmanager window to the front, press Select Dish and choose preDefined, then rafUbe213Dish. (Or use the dish you created by adding Raf1 and its associates.)
- In the resulting window (titled Initial net for rafUbe213Dish) press the Explore button in the tool bar. A little menu will drop down. Select "Occs". In the selection dialog open the S sublist (click on S) and click on Sos1-CLc. A check mark will appear on the left of Sos1-CLc "(both)" on the right. If you continue clicking on Sos1-CLc, "(both)" will become "(up)" then "(dn)" then the check mark will disappear an you are back to where you started. Keep clicking until you have a check mark with the "(both)" option. This means that you want to start exploring with all rules (and their connected occurrences) that are up or down stream of Sos1-CLc. The "(up)" option says only include rules that are immediately up stream, and the "(dn)" option says only include rules that are immediately down stream (from the selected occurrence). Press the OK button and a new window with the specified initial nodes will appear. The color code for explore graphs (see the color key on the right end of the tool bar) is the following: green occurrences have down stream connections to explore, blue occurrences have up stream connections to explore and cyan (blue-green) occurrences have both up and down stream connections to explore. Gray nodes have no unexplored connections.
There are many ways to explore -- you can explore up or down from all occurrences (that have unexplored connections) using the Up/Down buttons in the tool bar; you can select one or more occurrences to explore from (either by clicking on the occurrence as for goal setting followed by exploreSelected, or by using the Explore button in the tool bar), you can hide rules that appear in the graph, you can add new rules or occurrences that may have no current connections (via the Explore button). By default, each explore operation modifies the graph and the modified graph is displayed in the same window (the previous state is lost). If at some point you wish to save the current exploration state, but continue to explore, you can check the "New Frame" box in the tool bar to continue in a fresh window.
Lets try a few things.
- To explore down stream from Sos1-reloc-CLi, click on the occurrence labelled Sos1-reloc-CLi. Then check the explore down stream box in the information panel. (Notice the node turns yellow). Now press exploreSelected in the tool bar. A new rule and its additional occurrences appear in the graph.
- Hide rule 6 -- click on rule 6 and check the Hide Rule box in the information panel. Rule 6 will turn yellow. Now press the exploreSelected button and rule 6 will disappear from the graph along with PIP3-CLm and the two Hras occurrences. Notice that Sos1-reloc no longer has a down stream connection.
- Now unhide rule 6 -- click on the Explore button in the tool bar and select unhide Rules. A dialog will appear listing all the hidden rules, only one in this case. Open the sublist and click on 6.Hras.act.1 (the full rule name). Press the OK button. The rule does not reappear, but it is now accessible and Sos1-reloc-CLi turns green again.
- Explore down stream in a new window -- check the New Frame box and press the Down button. A new window appears with nodes connected down stream to the occurrences colored green or cyan (Crb2-reloc-CLi, EgfR-act-CLm, and Sos1-reloc-CLi).
Although there are features of PLA that we haven't used, this should give you a idea of what can be done, and the reference document will fill in missing details.